On this first day of May, in homage to the Sell in May soothsayers (and in the spirit of market trivia), let's survey the behavior of the months in the S&P Composite since 1928. The Composite is a spliced index of the earlier S&P 90 with the S&P 500. Because of its greater breadth, I prefer it to the Dow for historic research of this sort.
Market lore is full of monthly associations: The January Effect, Sell in May and Go Away, Summer Rallies, the September Slump, Manic-Depressive October, December Rallies, etc.
The first chart shows the average monthly gains/losses, excluding dividends, since 1928 for all twelve months. May is one of the three months with a negative average. Incidentally, the monthly average of all months lumped together is 0.59%. So May has underperformed the mean by 0.73%.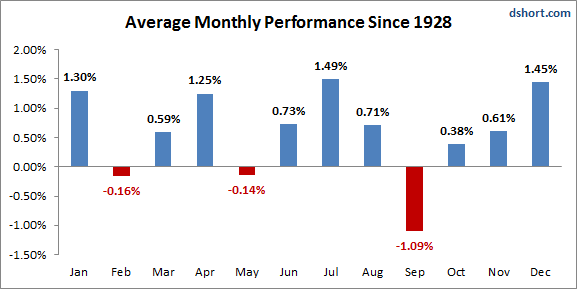
Dividing the Timeline
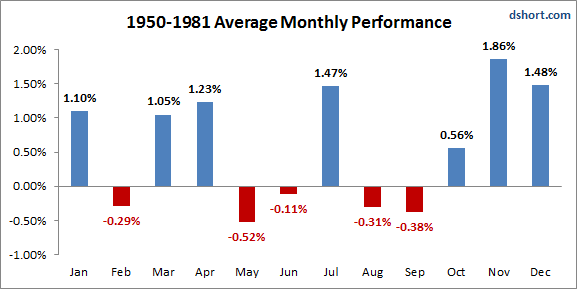
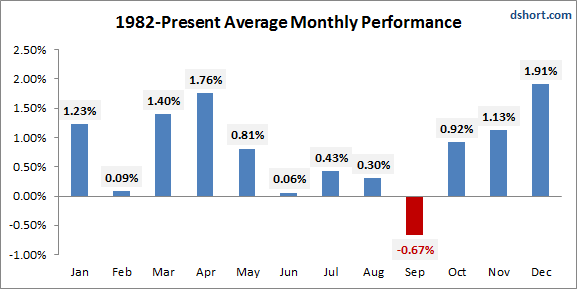
Has May consistently been a poor performer? The next three charts divvy up our 85-year period into three parts: 1928-1949, 1950-1981, and 1982-present. The rationale is that the first chart includes the Crash of 1929, Great Depression, WWII, and ends around the time of the secular market bottom in 1949. The second chart covers the cycle from the beginnings of the post-war rally through the Decade of Stagflation and market bottom in 1982. The third chart begins with the great Boomer market that followed and runs to the present.
Of course we could slice and dice the decades any number of ways, but an overview and three subsets (a four-chart total) about maxes out my energy and interest in this topic.
May has been a performance laggard in two of the three timeframes and the worst performer in one of the three (1950-1981).
Without further ado, I'll let the next three charts speak for themselves.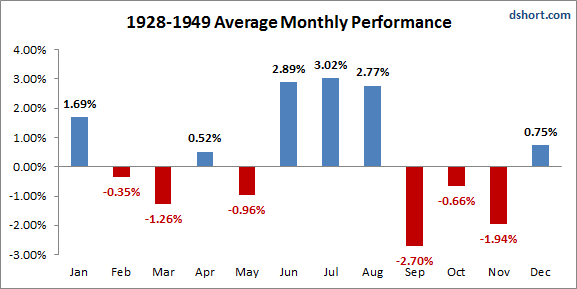
Lest the charts above give the false impression that May is a consistently poor performer, let's close with a distribution of performance over the past 85 years.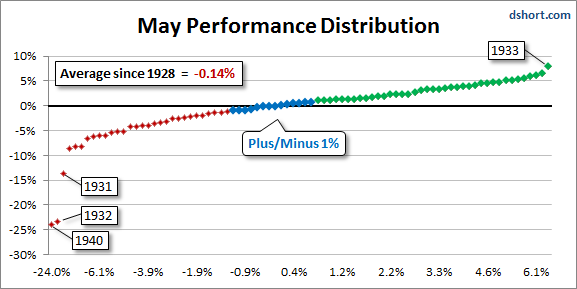
Across the entire 85-year timeframe, May has an average of -0.14%. But if we exclude the three negative outliers, the average jumps to 0.59%, which is spot on the overall monthly mean. Pretty amazing!
Let's hope May 2013 behaves more like it did in 1933 and not like one of those naughty negative outliers (or any of the red markers, for that matter).
- English (UK)
- English (India)
- English (Canada)
- English (Australia)
- English (South Africa)
- English (Philippines)
- English (Nigeria)
- Deutsch
- Español (España)
- Español (México)
- Français
- Italiano
- Nederlands
- Português (Portugal)
- Polski
- Português (Brasil)
- Русский
- Türkçe
- العربية
- Ελληνικά
- Svenska
- Suomi
- עברית
- 日本語
- 한국어
- 简体中文
- 繁體中文
- Bahasa Indonesia
- Bahasa Melayu
- ไทย
- Tiếng Việt
- हिंदी
Sell In May? A Brief Sanity Check
Published 05/01/2013, 03:46 PM
Updated 07/09/2023, 06:31 AM
Sell In May? A Brief Sanity Check
Latest comments
Loading next article…
Install Our App
Risk Disclosure: Trading in financial instruments and/or cryptocurrencies involves high risks including the risk of losing some, or all, of your investment amount, and may not be suitable for all investors. Prices of cryptocurrencies are extremely volatile and may be affected by external factors such as financial, regulatory or political events. Trading on margin increases the financial risks.
Before deciding to trade in financial instrument or cryptocurrencies you should be fully informed of the risks and costs associated with trading the financial markets, carefully consider your investment objectives, level of experience, and risk appetite, and seek professional advice where needed.
Fusion Media would like to remind you that the data contained in this website is not necessarily real-time nor accurate. The data and prices on the website are not necessarily provided by any market or exchange, but may be provided by market makers, and so prices may not be accurate and may differ from the actual price at any given market, meaning prices are indicative and not appropriate for trading purposes. Fusion Media and any provider of the data contained in this website will not accept liability for any loss or damage as a result of your trading, or your reliance on the information contained within this website.
It is prohibited to use, store, reproduce, display, modify, transmit or distribute the data contained in this website without the explicit prior written permission of Fusion Media and/or the data provider. All intellectual property rights are reserved by the providers and/or the exchange providing the data contained in this website.
Fusion Media may be compensated by the advertisers that appear on the website, based on your interaction with the advertisements or advertisers.
© 2007-2024 - Fusion Media Limited. All Rights Reserved.
