
Sealed Air Corporation (NYSE:SEE) delivered first-quarter 2018 adjusted earnings per share of 51 cents, up 19% year over year, beating the Zacks Consensus Estimate of 50 cents. 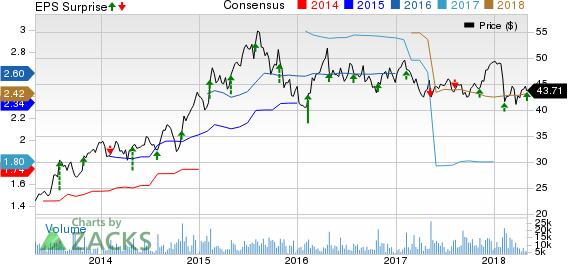

Sealed Air Corporation (SEE): Free Stock Analysis Report
DMC Global Inc. (BOOM): Free Stock Analysis Report
Ashtead Group PLC (ASHTY): Free Stock Analysis Report
Axon Enterprise, Inc (AAXN): Free Stock Analysis Report
Original post
Zacks Investment Research
Including special items, the company reported a loss of $1.25 per share, compared with a loss of 27 cents per share incurred in the year-ago quarter.
Total revenues increased 10% year over year on a reported basis to $1.13 billion in the quarter. Revenues missed the Zacks Consensus Estimate of $1.14 billion. Currency had a positive impact on total net sales of 4% or $36 million. Sales increased across all regions in the quarter.
Sealed Air Corporation Price, Consensus and EPS Surprise
Sealed Air Corporation price-consensus-eps-surprise-chart | Sealed Air Corporation Quote
Cost and Margins
Cost of sales went up 9% year over year to $757 million. Gross profit went up 12% to $374 million. Gross margin expanded 60 basis points (bps) to 33.1% in the quarter.
SG&A expenses decreased 2% to $194 million from the prior-year period. Adjusted earnings before interest, taxes, depreciation and amortization (EBITDA) were $205 million in the quarter compared with $182 million in the prior-year quarter. Adjusted EBITDA margin was 18.1% compared with 17.6% in the prior-year quarter.
Segment Performance
Food Care: Net sales advanced 6% year over year to $696 million. Currency had a positive impact of 3% or $20 million. On a constant dollar basis, net sales increased 3%. Adjusted EBITDA increased 10% year over year to $135 million.
Product Care: The segment reported net sales of $435 million, up 15% year over year and 11% on a constant dollar basis, primarily driven by the acquisition of Fagerdala. Currency had a positive impact on Product Care’s net sales of 4% or $15 million. Adjusted EBITDA increased 24% to $78 million.
Financial Updates
Cash and cash equivalents were $327 million as of Mar 31, 2018, down from $594 million as of Dec 31, 2017. Cash used in operating activities was $24 million during the first-quarter 2018, compared with cash flow from operating activities of $17 million in the prior-year quarter.
As of Mar 31, 2018, Sealed Air’s net debt came in at $3.1 billion, up from $2.7 billion as of Dec 31, 2017 owing to use of working capital and amounts paid for share repurchases.
From Jan 1, 2018 to Apr 30, 2018, the company repurchased approximately $426 million or 9.3 million shares through both open market repurchases and the completion of an Accelerated Share Repurchase program. Sealed Air’s Board of Directors reset the company’s share repurchase program authorization on May 2, 2018, to $1 billion. This program has no expiration date and replaces the previous authorizations, representing an increase of nearly $500 million.
Guidance
Sealed Air projects net sales of approximately $4.75 to $4.80 billion for 2018, a constant dollar growth rate of approximately 4.5%. Adjusted EBITDA from continuing operations is guided at $890-$910 million. Currency is anticipated to have a favorable impact of approximately $110 million on net sales and $20 million on adjusted EBITDA. Adjusted earnings per share is expected to be $2.45-$2.55, up from the previous $2.35-$2.45 driven by upbeat first quarter performance along with favorable global business trends.
Free Cash Flow for 2018 will be around $400 million, based on assumption of capital expenditures of approximately $160 million and cash restructuring payments of approximately $20 million, which excludes restructuring payments of $30 million to address stranded costs.
Share Price Performance
Over the past year, Sealed Air has grossly underperformed the industry with respect to price performance. While the stock dipped 1.2%, the industry recorded growth of 3.0%.
Zacks Rank & Other Stocks to Consider
Currently, Sealed Air carries a Zacks Rank #2 (Buy).
Other top-ranked stocks in the same sector include Axon Enterprise, Inc (NASDAQ:AAXN) , DMC Global Inc. (NASDAQ:BOOM) and Ashtead Group (LON:AHT) plc (OTC:ASHTY) . All three stocks sport a Zacks Rank #1 (Strong Buy). You can see the complete list of today’s Zacks #1 Rank stocks here.
Axon Enterprise has a long-term earnings growth rate of 25%. The stock has appreciated 70% in a year’s time.
DMC Global has a long-term earnings growth rate of 20%. Its shares have soared 200% in the past year.
Ashtead Group has a long-term earnings growth rate of 15%. The stock has appreciated 38% in a year’s time.
5 Medical Stocks to Buy Now
Zacks names 5 companies poised to ride a medical breakthrough that is targeting cures for leukemia, AIDS, muscular dystrophy, hemophilia, and other conditions.
New products in this field are already generating substantial revenue and even more wondrous treatments are in the pipeline. Early investors could realize exceptional profits.
Sealed Air Corporation (SEE): Free Stock Analysis Report
DMC Global Inc. (BOOM): Free Stock Analysis Report
Ashtead Group PLC (ASHTY): Free Stock Analysis Report
Axon Enterprise, Inc (AAXN): Free Stock Analysis Report
Original post
Zacks Investment Research