
Scientific Games Corp. (NASDAQ:SGMS) reported first-quarter 2017 loss of 92 cents per share, which was wider than the Zacks Consensus Estimate of a loss of 74 cents but narrower than the year-ago quarter loss figure of $1.07.
Driven by growth across board, revenues increased 6.4% from the year-ago quarter to $725.4 million, which was better than the Zacks Consensus Estimate of $711.5 million. However, unfavorable foreign currency exchange impacted revenues by $8.1 million.
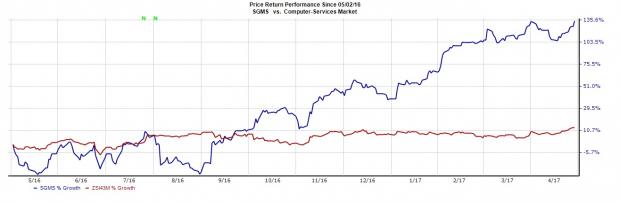
We note that Scientific Games has outperformed the Zacks Computer Services industry in the last year. While the stock returned 134.02%, the industry gained 13.07% in the same time.
Quarter Details
Gaming Segment revenues increased 4.3% year over year to $440 million. The increase was primarily attributed to growth in machine sales, gaming systems sales and table products by 16.1%, 3% and 15.8%, respectively, partly offset by lower revenues in gaming operations (down 6.5%). Unfavorable foreign currency exchange also impacted revenues by $5.1 million.
During the quarter, the company shipped 5,862 new gaming machines globally. International shipments were up 5%, reflecting increases in both replacements and new casino openings.
Scientific Games Corp Price, Consensus and EPS Surprise
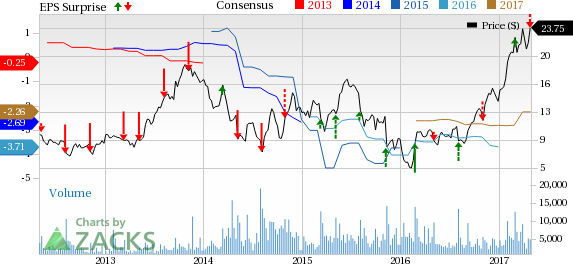
Scientific Games Corp Price, Consensus and EPS Surprise | Scientific Games Corp Quote
Lottery Segment revenues were up 0.7% year over year to $189.1 million. Instant games revenues grew 4.5% whereas Services’ revenues declined 13.5% from the year-ago quarter. Product Sales grew 16.5%. Unfavorable foreign currency exchange impacted revenues by $2 million.
Interactive Group revenues surged 32.6% year over year to $96.3 million, driven by robust performance from social gaming and other interactive, which advanced 33.2% and 29.8%, respectively.
Attributable earnings before interest, taxes, depreciation and amortization (AEBITDA) increased 10.7% to $286.6 million. AEBITDA from the Gaming and Lottery Systems declined 9.7% and 4.7% to $209.7 million and $85.3 million, respectively. Interactive AEBITDA surged almost 49.4% to $23 million.
Balance Sheet & Cash Flow
Scientific Games exited the quarter with $131.9 million compared with $115.1 million in the previous quarter. The company’s long-term debt was $8.07 billion compared with $8.02 billion as of Dec 31, 2016. The company lowered debt by paying down $45 million.
Cash flow from operations was $110 million compared with $101.1 million in the previous year quarter.
Zacks Rank & Stocks to Consider
Currently, Scientific Games carries a Zacks Rank #3 (Hold). Better-ranked stocks are Ebix, Inc. (NASDAQ:EBIX) , LogMeIn, Inc. (NASDAQ:LOGM) and Hasbro (NASDAQ:HAS) in the broader sector. While Ebix and LogMeln sport a Zacks Rank #1 (Strong Buy), Hasbro carries a Zacks Rank #2 (Buy). You can see the complete list of today’s Zacks #1 Rank stocks here.
In the trailing four quarters, Ebix, LogMeIn and Hasbro have yielded positive average earnings surprises of 14.38%, 38.99% and 16.54%, respectively.
Sell These Stocks. Now.
Just released, today's 220 Zacks Rank #5 Strong Sells demand urgent attention. If any are lurking in your portfolio or Watch List, they should be removed immediately. These are sinister companies because many appear to be sound investments. However, from 1988 through 2016, stocks from our Strong Sell list have actually performed 6X worse than the S&P 500. See today's Zacks "Strong Sells" absolutely free >>.
Scientific Games Corp (SGMS): Free Stock Analysis Report
Ebix, Inc. (EBIX): Free Stock Analysis Report
LogMein, Inc. (LOGM): Free Stock Analysis Report
Hasbro, Inc. (HAS): Free Stock Analysis Report
Original post
Zacks Investment Research