
Science Applications (NYSE:SAIC) reported third-quarter fiscal 2020 earnings of $1.39 per share, missing the Zacks Consensus Estimate by 3.47%. However, the bottom line improved 2.96% year over year.
Moreover, revenues jumped 38% from the year-ago quarter to $1.6 billion but lagged the Zacks Consensus Estimate of $1.63 billion. Revenues realized from the acquisition of Engility drove the top line. Strong performance of the company’s contract portfolio is a tailwind.
However, adjusting for the impact of acquired revenues, the metric declined 1.5% due to acquisition related dis-synergies
Quarter in Detail
Net bookings for the quarter were approximately $2.2 billion, reflecting a book-to-bill ratio of approximately 1.4%.
Science Applications’ estimated backlog of signed business deals was approximately $14.5 billion of which, $2.9 billion was funded.
Adjusted operating margin contracted 40 basis points (bps) year over year to 5.8% in the reported quarter.
Adjusted EBITDA of $135 million increased 38%. Adjusted EBITDA margin was flat at 8.3%.
Science Applications International Corporation Price, Consensus and EPS Surprise
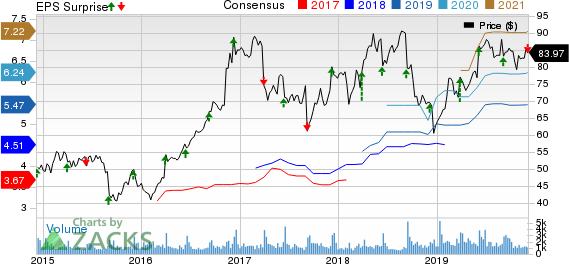
Science Applications International Corporation price-consensus-eps-surprise-chart | Science Applications International Corporation Quote
Balance Sheet & Cash Flow
Science Applications ended the quarter with cash and cash equivalents of $162 million, down from $179 million reported in the previous quarter.
Operating cash flow was $116 million, up from $95 million in the sequential quarter. Free cash flow was $116 million compared with $90 million in the preceding quarter.
During the quarter, Science Applications deployed $24 million of capital, $21 million to cash dividends and $3 million to debt repayment.
Guidance
For fiscal 2020, the company expects second-half revenues to be consistent with the first-half figure of $3.6 billion.
For the full fiscal, adjusted EBITDA margin is likely to be at the mid-to-upper-end of the 8.2-8.4% range.
Free cash flow is expected to be at least $425 million for fiscal 2020.
Zacks Rank & Stocks to Consider
SAIC currently has a Zacks Rank #3 (Hold). A few better-ranked stocks in the broader technology sector are Keysight Technologies Inc. (NYSE:KEYS) , Fortinet, Inc. (NASDAQ:FTNT) and CommVault Systems, Inc. (NASDAQ:CVLT) , each flaunting a Zacks Rank #1 (Strong Buy). You can see the complete list of today’s Zacks #1 Rank stocks here.
Long-term earnings growth rate for Keysight, Fortinet and CommVault Systems is currently estimated at 9.1%, 14% and 10%, respectively.
Just Released: Zacks’ 7 Best Stocks for Today
Experts extracted 7 stocks from the list of 220 Zacks Rank #1 Strong Buys that has beaten the market more than 2X over with a stunning average gain of +24.6% per year.
These 7 were selected because of their superior potential for immediate breakout.
See these time-sensitive tickers now >>
Fortinet, Inc. (FTNT): Free Stock Analysis Report
Science Applications International Corporation (SAIC): Free Stock Analysis Report
CommVault Systems, Inc. (CVLT): Free Stock Analysis Report
Keysight Technologies Inc. (KEYS): Free Stock Analysis Report
Original post
Zacks Investment Research