Currencies
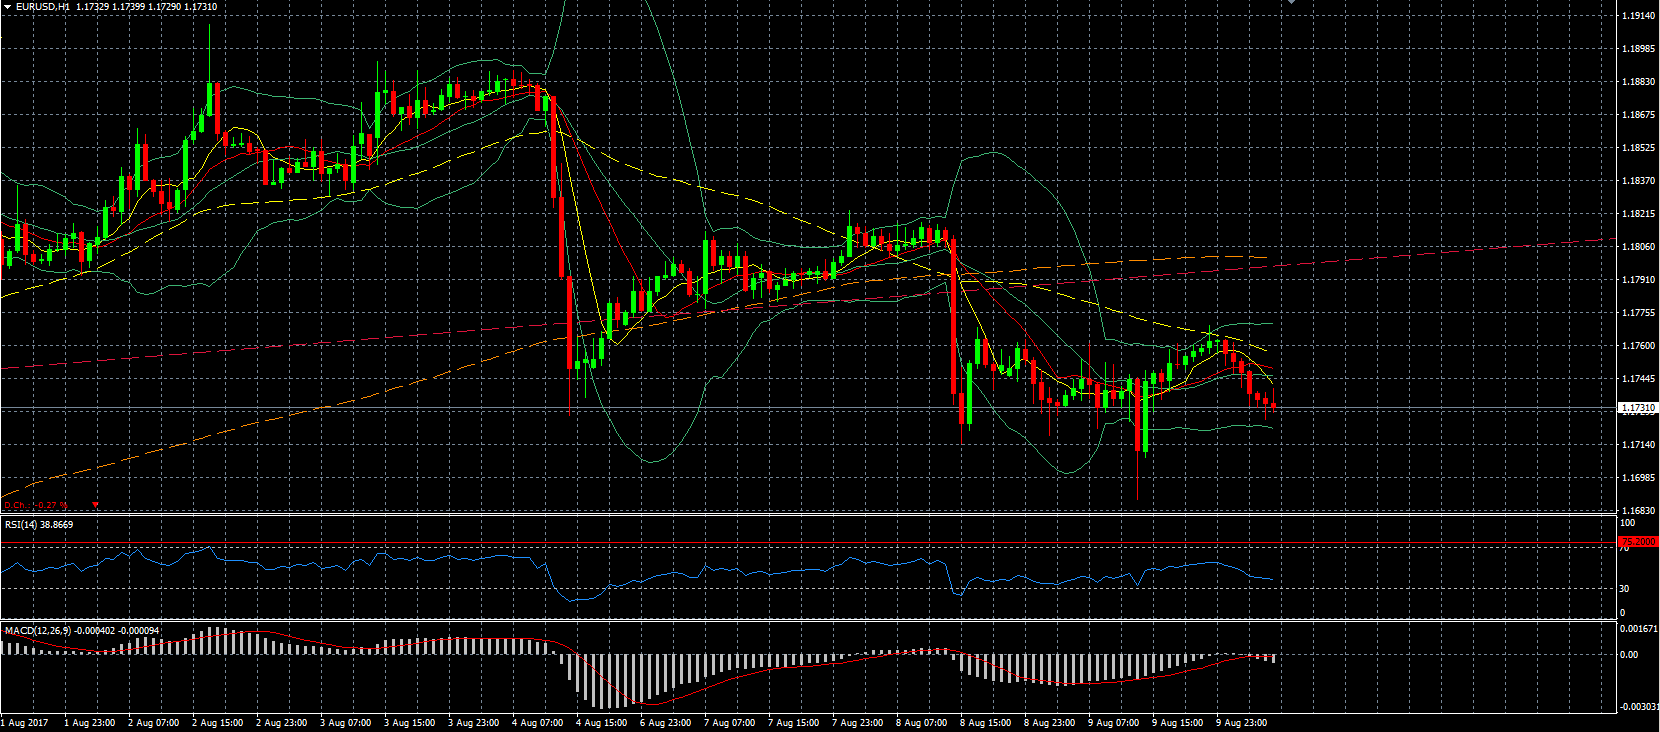
EUR/USD – is looking for direction as it is being going down on the latest strong data out of the US and in order for the USD to continue to strengthen good inflation data is needed today, but is also moving up as the increased risk off sentiment is causing an outflux out of USD assets, although it is much less than we have seen in the past and the EUR is not able to really benefit. As mentioned the inflation data today will be important and possible also the comments from FED member Dudley shortly thereafter.
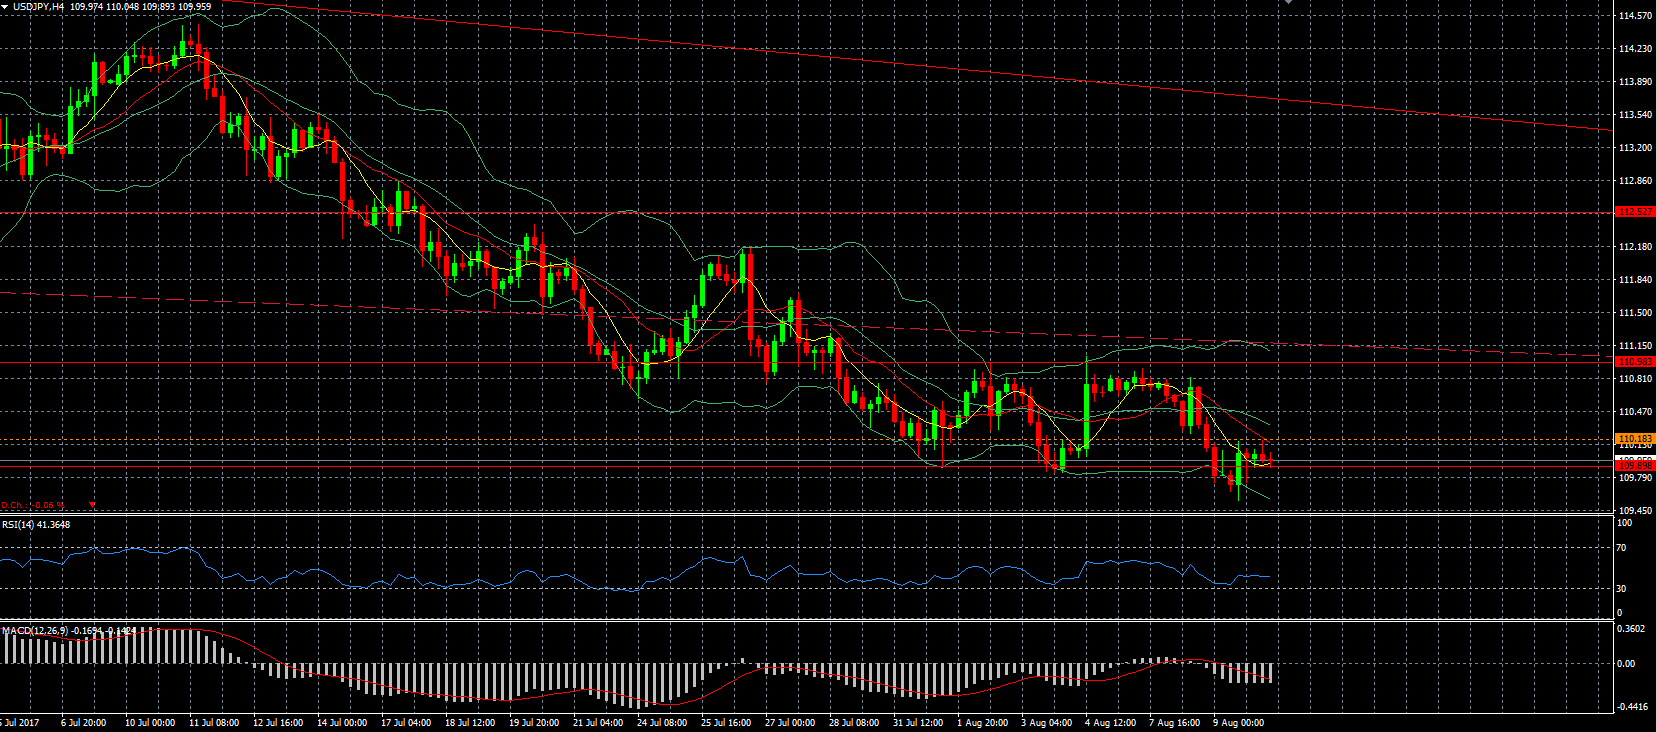
USD/JPY – the JPY is still stronger as the tension with North Korea is still an issue, although a bit less and as such it has managed to climb a little bit to trade around the support level just below the 110 level. The rhetoric has still not ended and as such we could expect a further appreciation of the JPY, although there are some that are trying to tone down the rhetoric.
GBP/USD – remains trading around the 1.30 level as we await production data out of the UK which is expected not to be that strong in the first place. The fact that the BOE is not likely to raise the interest rate took quite some wind out of the GBP run as also Brexit is obviously lingering over the GBP as always.
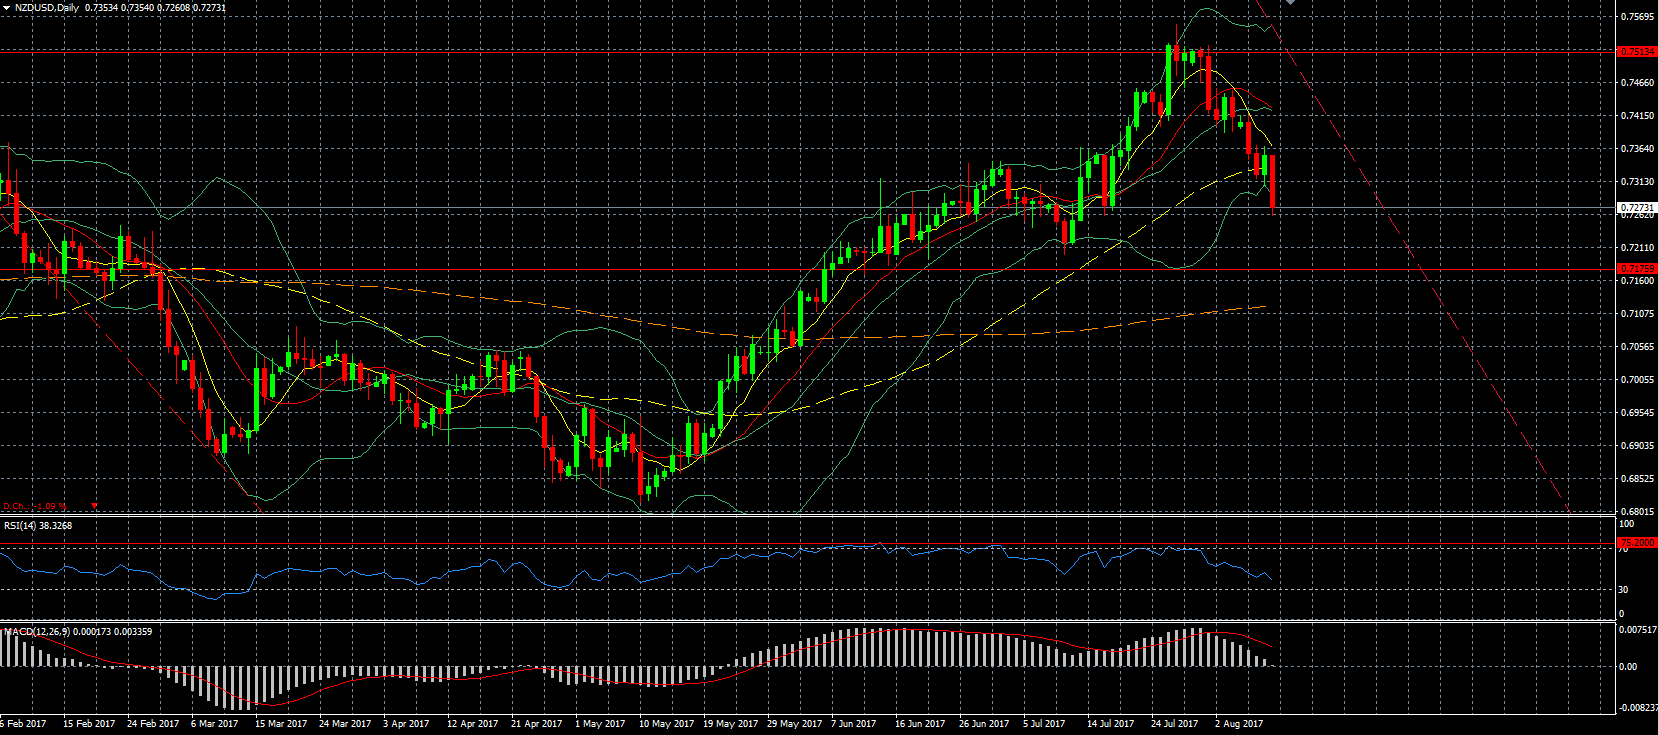
NZD/USD – as expected the RBNZ didn’t change the interest rate level and indicated it expected that to remain the level for the foreseeable future amid a low inflation level. As indicated yesterday, the RBNZ doesn’t want to see a NZD which is too high, something RBNZ Governor Wheeler indicated in his comments when he said that he prefers to see a weaker NZD and that the RBNZ could interfere whenever necessary.
Indices
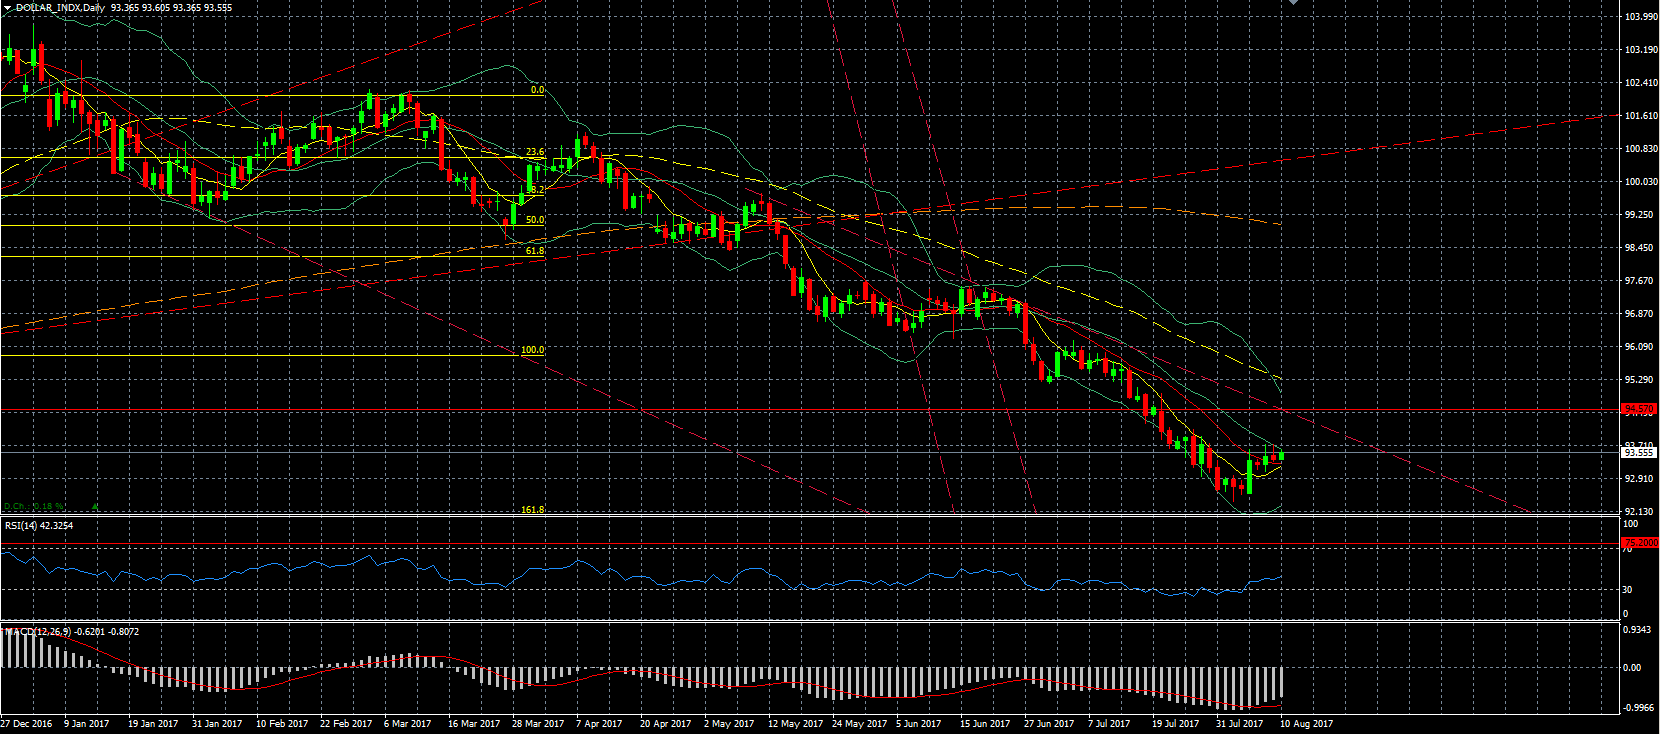
Dollar Index – is starting to trade a bit sideways this week without too much movement, although that is likely to change today and tomorrow as we await inflation data out of the US.
S&P 500 – remains under pressure as tensions are still high, even though US Secretary of State Tillerson tried to lower them by saying that a military option is not being prepared and the Americans can sleep well at night as the threat hasn’t changed.
Commodities
Corn, Cotton, Soybean, Sugar & Wheat – could all be very interesting today, as the monthly WASDE report is published which tends to cause for quite some volatility in said agricultural instruments.
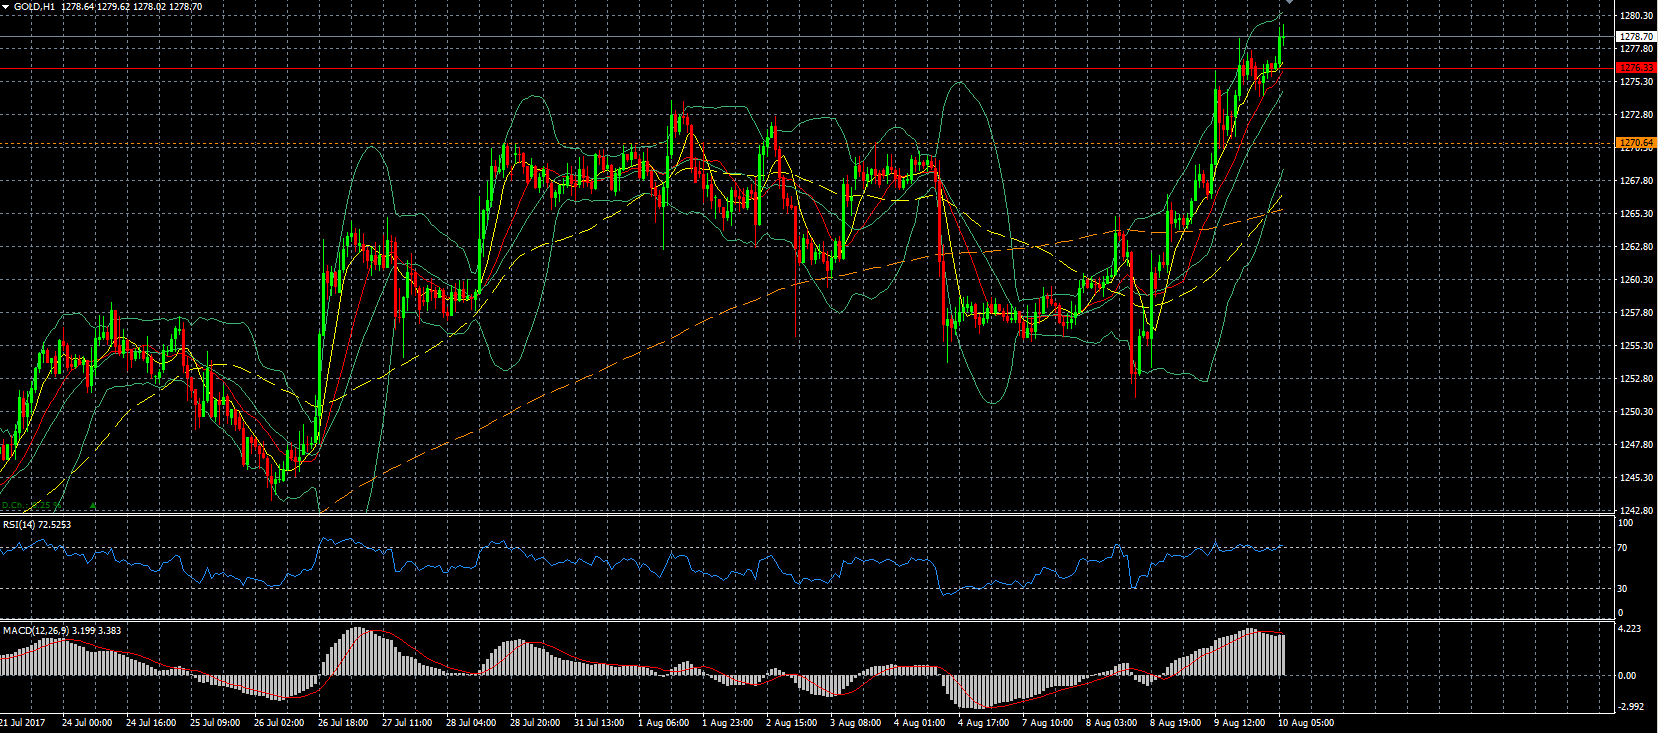
Gold – continued to benefit from the demand in safe havens due to the Korean crisis as it breached through the resistance around the 1270 level to reach the next resistance level around the 1276 level to trading above this level as well now. It has reached the highest level in 2 months and if the tensions keep on increasing we could see another attempt at the 1300 level. However, we have inflation data today, and if inflation is picking up, we can see gold move down as that should strengthen the USD. A miss though could help gold move towards that 1300 level.
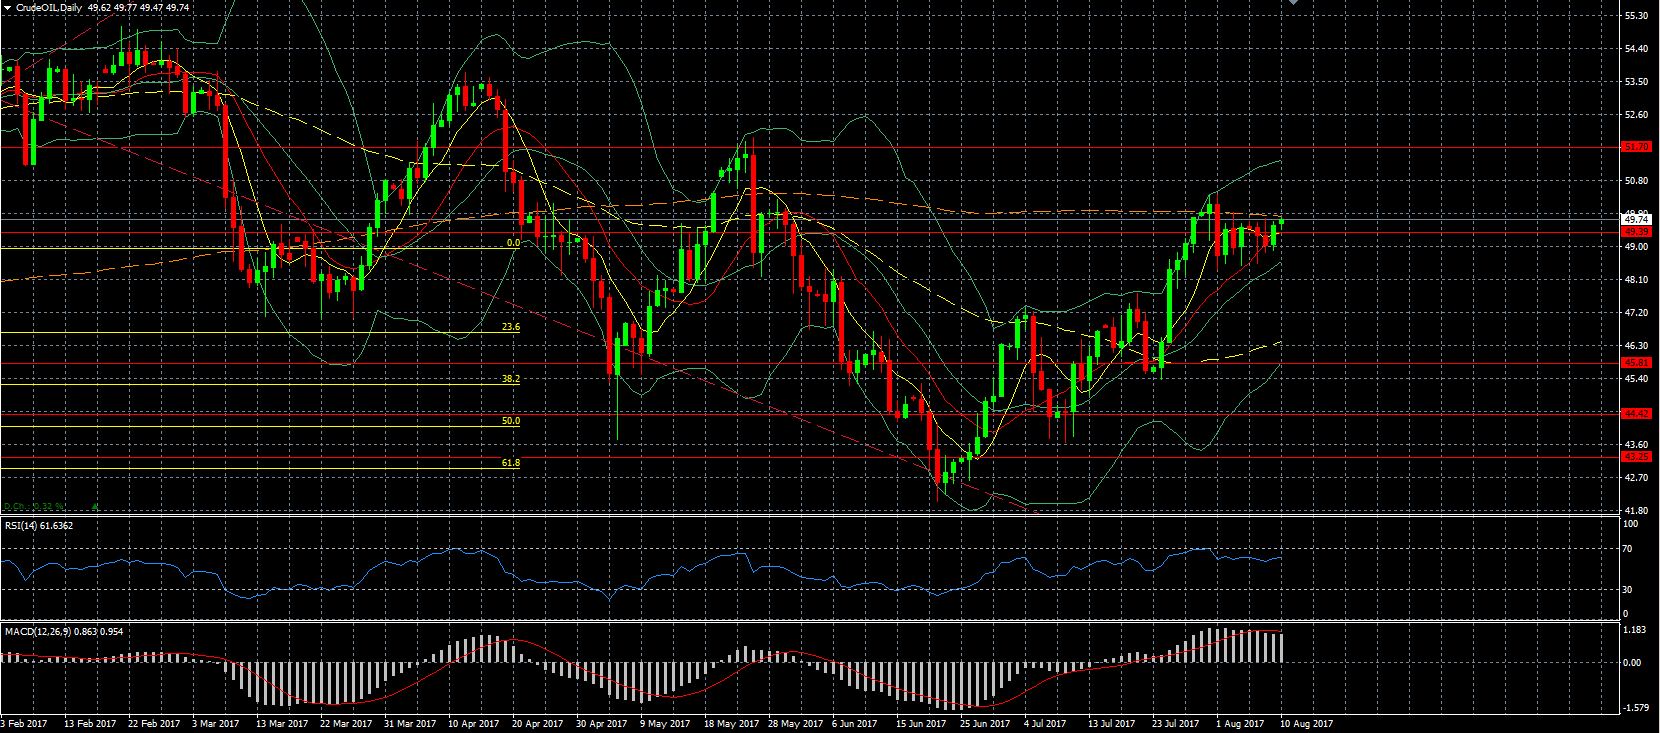
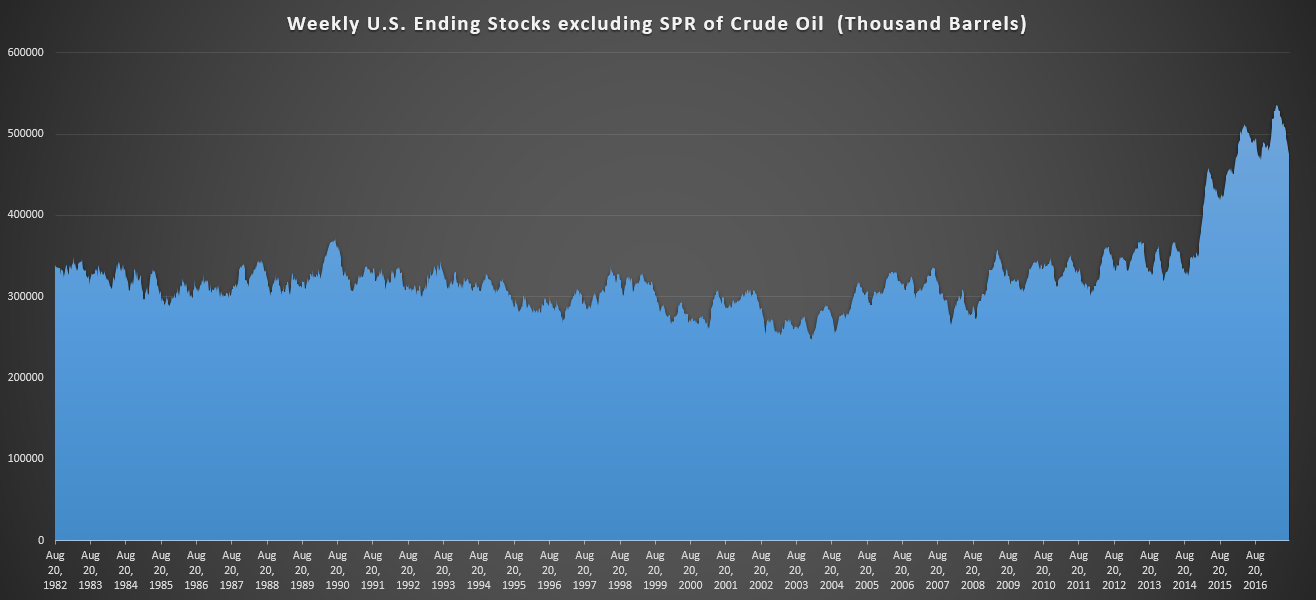
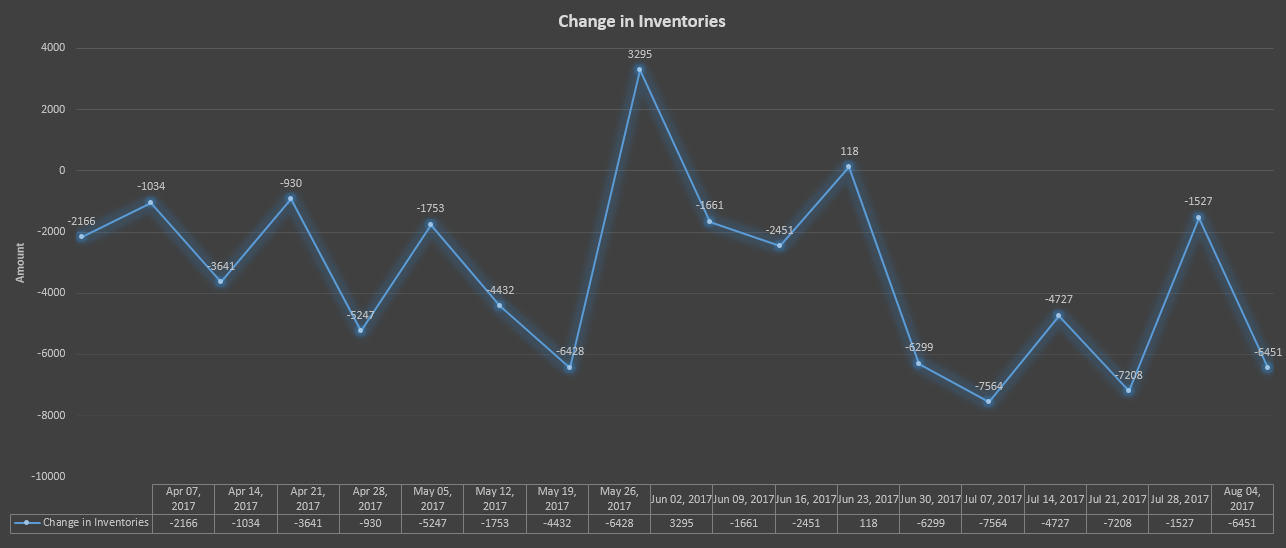
Oil – saw some volatility but not as large as we have seen in the past. Nonetheless, oil moved up as inventories indeed dropped by 6.5 million barrels and more surprisingly also production dropped slightly. Output from refineries increased to levels not seen in years which indicates that there is still sufficient demand. It has been indicated that production is not leveling out, as we have seen that is not increasing as it has in the past and the number of active rigs is stalling. The inventories are now 17.5 million barrels below the level it was this time last year, so we are seeing a tightening of the market. Since April we have seen inventories drop by over 60 million barrels and have had only 2 weeks which saw inventories increase. Gasoline inventories however increased surprisingly which capped further gains for now as we are also approaching the end of the driving season in the US. Today will also see a joint press conference of the Saudi and Iraqi oil ministers, addressing the oil market as well as the OPEC’s monthly report.
Stocks
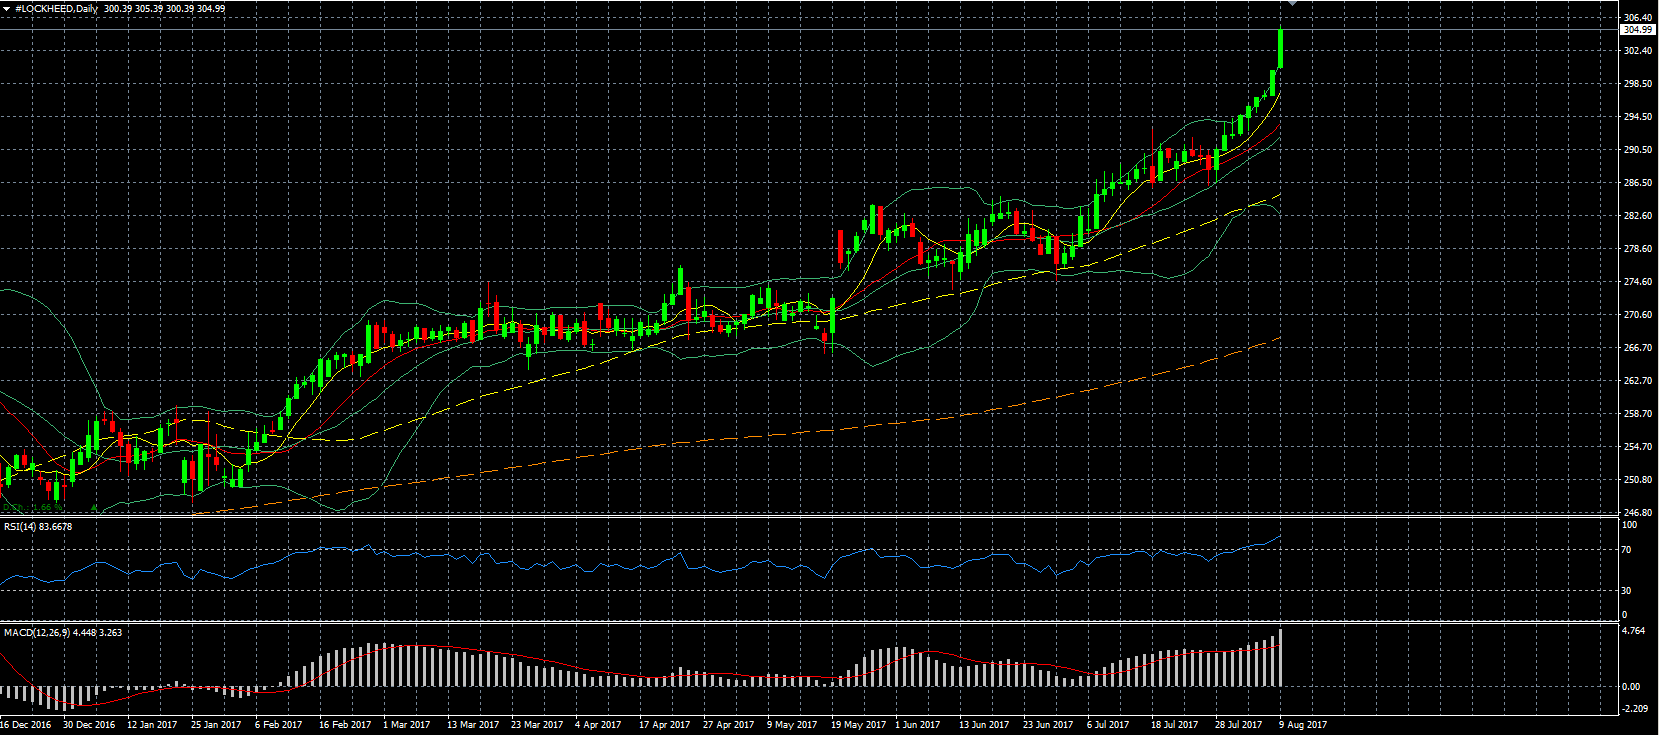
Lockheed Martin (NYSE:LMT) – soared to new record highs amid the tensions on the Korean Peninsula as the defense company benefits from the increased tensions, as an escalation will undoubtedly lead to increased defense spending even it doesn’t come to an actual confrontation.
Snapchat – moved up again a day ahead of its earnings report which will be closely watched. After its first earnings report Snapchat dropped sharply as it posted a larger than expected loss and also had trouble growing its user base as well.
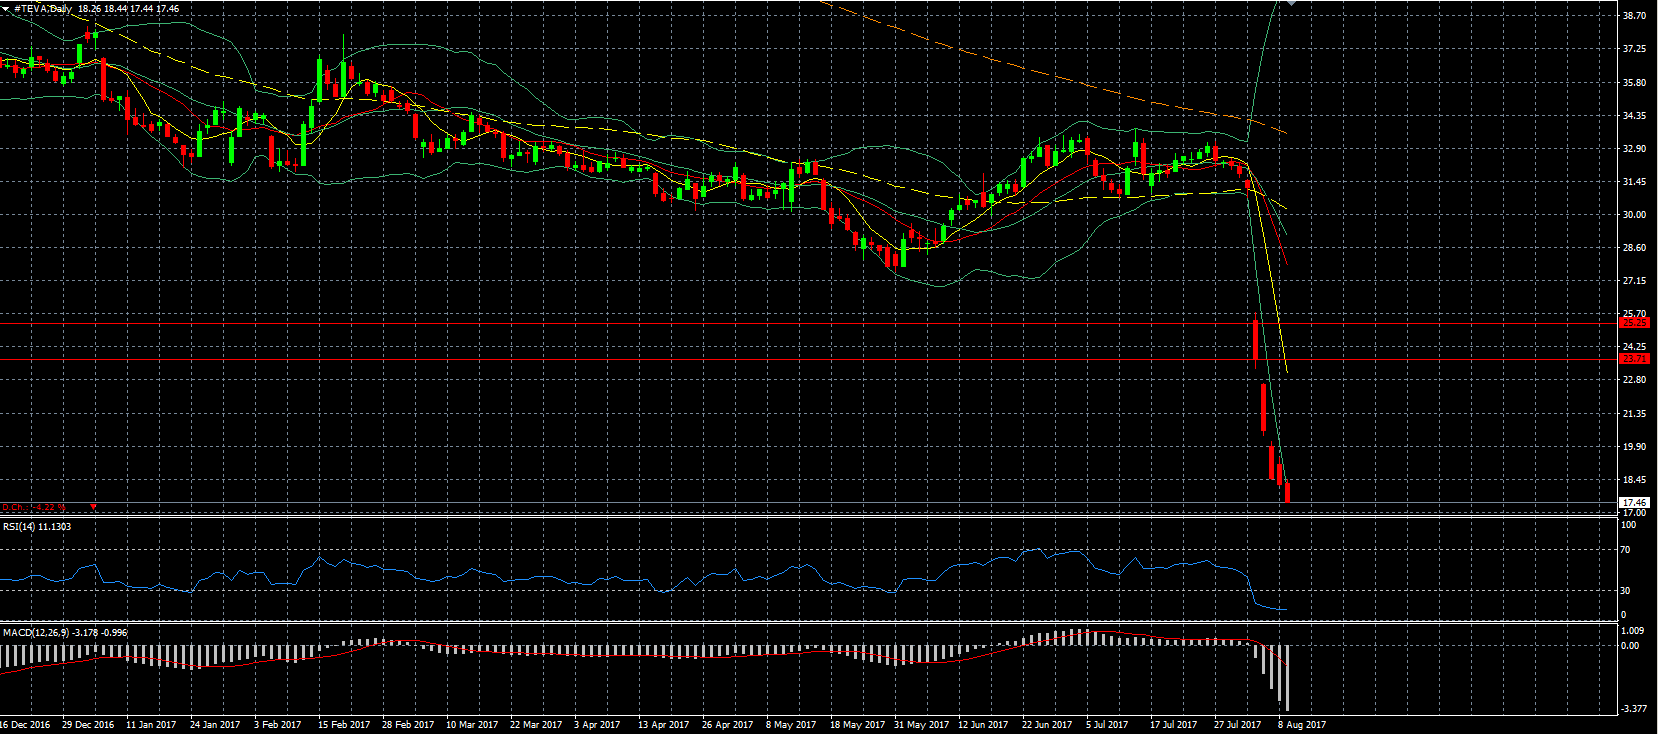
Teva – posted its 8th consecutive day of losses and has dropped already dropped over 45% this month alone and is headed to be halved this week if it continues like this. If the company can turn around and get its debt reduced and appoint a good CEO and increase its profit margins, we might look back at today and see that this was a great opportunity to get into Teva, although until that happens we could see the stock slide further.
