Join +750K new investors every month who copy stock picks from billionaire's portfoliosSign Up Free

S&P Locked In Familiar Range; Gold Breaks Resistance

Published 07/01/2014, 05:42 AM
Updated 07/09/2023, 06:31 AM
US500
-
DX
-
GC
-
CL
-

US Dollar Hints at Key Reversal with Support Break

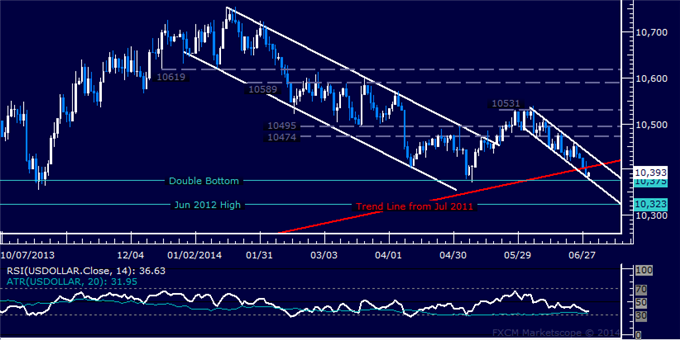
Prices may have initiated a substantial downward reversal after prices broke below a trend guiding the uptrend since July 2011. Sellers are now testing the 10375-79 area, marked by a double bottom and the floor of a falling channel set from early June. A daily close below this barrier would initially expose the June 2012 high at 10323. The trend line – now at 10404 – has been recast as near-term resistance. A move back above that clears the way for a test of the channel top at 10434.
USD Daily Chart

S&P 500 Remains Locked in Familiar Trading Range

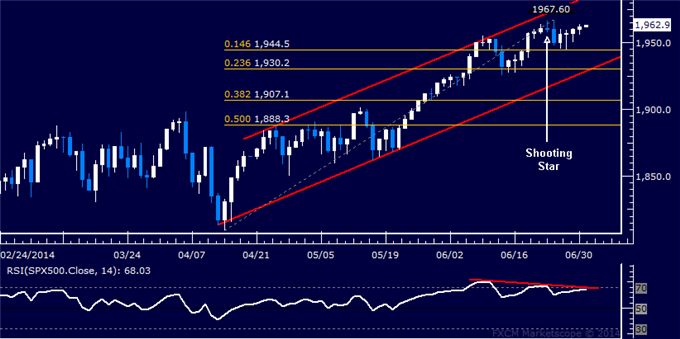
Prices turned lower as expected after putting in a Shooting Star candlestick coupled with negative RSI divergence, but the move lower was swiftly cut short at support marked by the 14.6% Fibonacci retracement (1944.50). Positioning has now taken on a consolidative tone, but bearish overtones remain. A daily close below support initially targets the 23.6% level at 1930.20. Alternatively, a reversal above the June 24 high at 1967.60 aims for a rising channel top at 1984.80.
S&P Daily Chart

Gold Breaks Resistance But Follow-Through Suspect

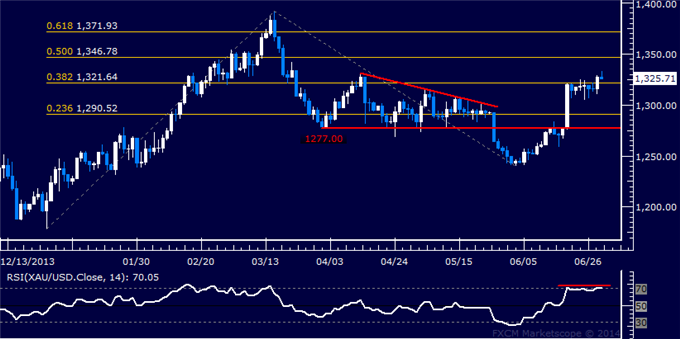
Prices broke higher after oscillating in a narrow range for over a week, taking out resistance at 1321.64 marked by the 38.2% Fibonacci expansion. Buyers now aim to challenge the 50% level at 1346.78, with a further push above that eyeing the 61.8% Fib at 1371.93. Negative RSI divergence warns upside momentum may be short-lived however. A turn back below 1321.64 exposes the 1300/oz figure, followed by the 1277.00-90 zone bracketed by the April 1 low and the 23.6% expansion.
Gold Daily Chart

Crude Oil

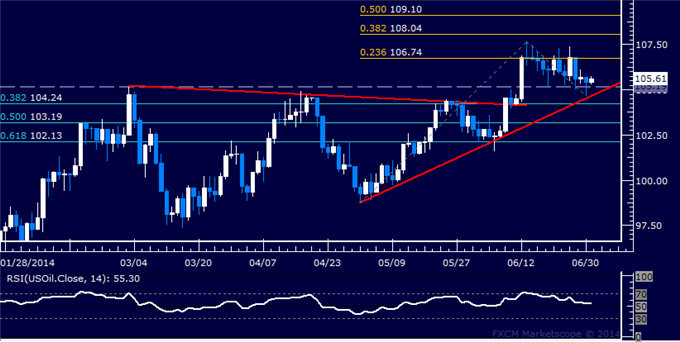
Prices remain in consolidation mode below resistance at 106.74, the 23.6% Fibonacci expansion.A daily close above this barrier initially targets the 38.2% level at 108.04. Alternatively, a reversal below support in the 104.84-105.19 area – marked by a rising trend line set from early May and the March 3 high – exposes the 38.2% Fib retracement at 104.24.
Crude Daily Chart

Original post

Latest comments

Loading next article…
Risk Disclosure: Trading in financial instruments and/or cryptocurrencies involves high risks including the risk of losing some, or all, of your investment amount, and may not be suitable for all investors. Prices of cryptocurrencies are extremely volatile and may be affected by external factors such as financial, regulatory or political events. Trading on margin increases the financial risks.
Before deciding to trade in financial instrument or cryptocurrencies you should be fully informed of the risks and costs associated with trading the financial markets, carefully consider your investment objectives, level of experience, and risk appetite, and seek professional advice where needed.
Fusion Media would like to remind you that the data contained in this website is not necessarily real-time nor accurate. The data and prices on the website are not necessarily provided by any market or exchange, but may be provided by market makers, and so prices may not be accurate and may differ from the actual price at any given market, meaning prices are indicative and not appropriate for trading purposes. Fusion Media and any provider of the data contained in this website will not accept liability for any loss or damage as a result of your trading, or your reliance on the information contained within this website.
It is prohibited to use, store, reproduce, display, modify, transmit or distribute the data contained in this website without the explicit prior written permission of Fusion Media and/or the data provider. All intellectual property rights are reserved by the providers and/or the exchange providing the data contained in this website.
Fusion Media may be compensated by the advertisers that appear on the website, based on your interaction with the advertisements or advertisers.
© 2007-2024 - Fusion Media Limited. All Rights Reserved.