Durable Goods for April came in above expectations before the market opened on Friday, but the S&P 500 opened lower and slipped to its -0.89% intraday a little over 30 minutes later. The remainder of the day was a steady struggle higher with a touch of drama in the final hour of trading. The index closed the day with a modest loss of 0.06%, which tallies to a 1.07% loss for the week. This is the first negative week after five weekly gains.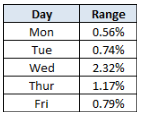
The real drama this past week was on Wednesday, which had the fourth highest intraday range of 2013. Why? Confusion over the Fed's strategy for tapering QE. On Tuesday two of the Fed Presidents made dovish sounds, and Chairman Bernanke's congressional testimony on Wednesday morning was harmoniously dovish. But the post-testimony Q&A sent mixed messages about the odds of near-term tapering, and the 2 PM release of the FOMC minutes added to the confusion.
Here is a 15-minute look at the week.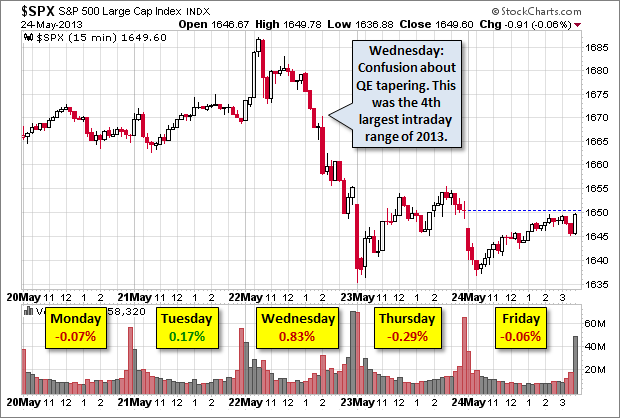
In case you're wondering about the other three higher intraday ranges so far this year, see the chart below. The first trading session of the year following the disappearance of the Fiscal Cliff saw a 2.54% gain, the same as the range. The second, with a 2.55% range, was a 1.83% selloff on February 25th after the Italian election fiasco. The third, with a 2.36% range, was on April 15, the worst selloff so far in 2013. Factors included weak Chinese GDP, a swan-dive in gold and other commodities, and the Boston Marathon terrorism. The fourth, with an intraday range of 2.32%, was Wednesday's befuddlement over apparent mixed messages from the Fed on the odds of near-term tapering of QE.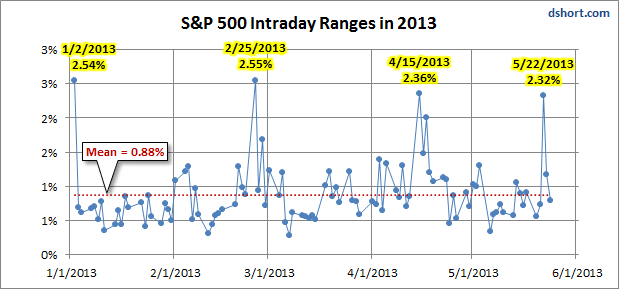
Not surprisingly on a relatively eventless day before an extended holiday weekend, volume for the S&P 500 was 25% below its 50-day moving average.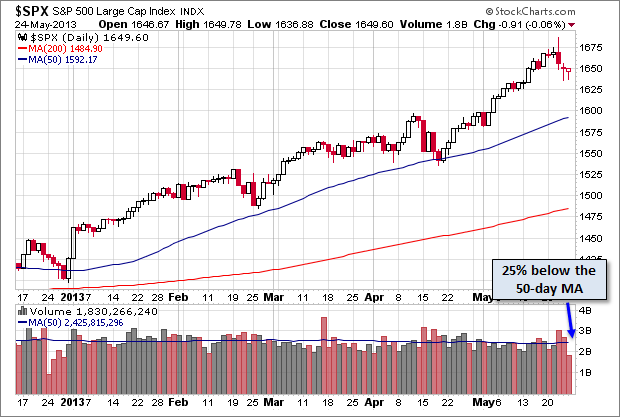
The S&P 500 is now up 15.66% for 2013 and 1.17% below the all-time closing high of May 21.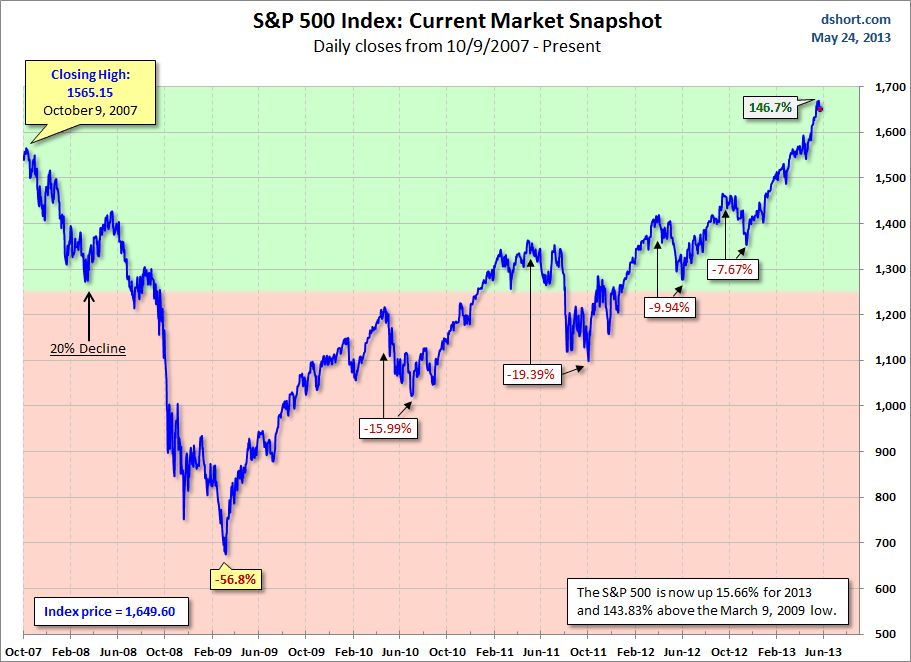
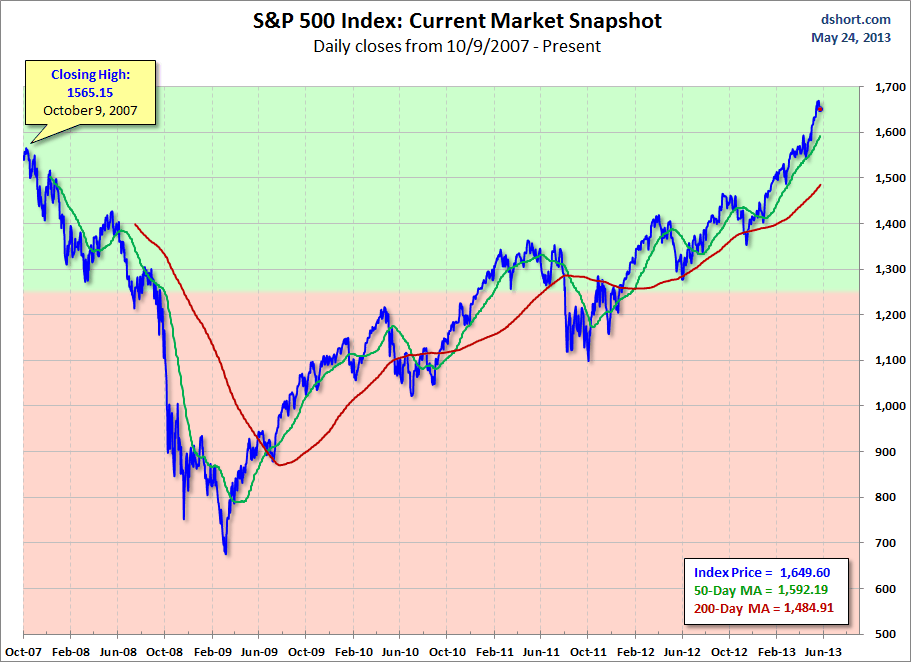
For a better sense of how these declines figure into a larger historical context, here's a long-term view of secular bull and bear markets in the S&P Composite since 1871.
- English (UK)
- English (India)
- English (Canada)
- English (Australia)
- English (South Africa)
- English (Philippines)
- English (Nigeria)
- Deutsch
- Español (España)
- Español (México)
- Français
- Italiano
- Nederlands
- Português (Portugal)
- Polski
- Português (Brasil)
- Русский
- Türkçe
- العربية
- Ελληνικά
- Svenska
- Suomi
- עברית
- 日本語
- 한국어
- 简体中文
- 繁體中文
- Bahasa Indonesia
- Bahasa Melayu
- ไทย
- Tiếng Việt
- हिंदी
S&P 500 Snapshot: A Fractional Loss Ends A Strange Week
Published 05/26/2013, 02:45 AM
Updated 07/09/2023, 06:31 AM
S&P 500 Snapshot: A Fractional Loss Ends A Strange Week
3rd party Ad. Not an offer or recommendation by Investing.com. See disclosure here or
remove ads
.
Latest comments
Install Our App
Risk Disclosure: Trading in financial instruments and/or cryptocurrencies involves high risks including the risk of losing some, or all, of your investment amount, and may not be suitable for all investors. Prices of cryptocurrencies are extremely volatile and may be affected by external factors such as financial, regulatory or political events. Trading on margin increases the financial risks.
Before deciding to trade in financial instrument or cryptocurrencies you should be fully informed of the risks and costs associated with trading the financial markets, carefully consider your investment objectives, level of experience, and risk appetite, and seek professional advice where needed.
Fusion Media would like to remind you that the data contained in this website is not necessarily real-time nor accurate. The data and prices on the website are not necessarily provided by any market or exchange, but may be provided by market makers, and so prices may not be accurate and may differ from the actual price at any given market, meaning prices are indicative and not appropriate for trading purposes. Fusion Media and any provider of the data contained in this website will not accept liability for any loss or damage as a result of your trading, or your reliance on the information contained within this website.
It is prohibited to use, store, reproduce, display, modify, transmit or distribute the data contained in this website without the explicit prior written permission of Fusion Media and/or the data provider. All intellectual property rights are reserved by the providers and/or the exchange providing the data contained in this website.
Fusion Media may be compensated by the advertisers that appear on the website, based on your interaction with the advertisements or advertisers.
© 2007-2024 - Fusion Media Limited. All Rights Reserved.
