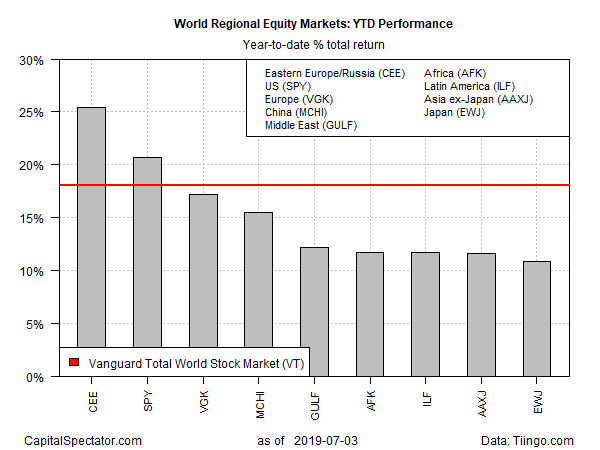
All the world’s major regions for equities are posting solid gains so far this year, but markets in Russia and Eastern Europe have pulled well ahead of the field in recent weeks, based on a set of exchange-traded products.
The top performer through Wednesday, July 3: Central and Eastern Europe Fund (Central Europe Russia & Turkey Fund (NYSE:CEE)), which is up a blistering 25.4% so far this year. CEE, the only U.S.-listed fund that targets Russia and Eastern European markets, had been pacing the rise in US equities for much of this year before a breakout rally started in mid-May.
Most of CEE’s surge is due to Russian shares, which dominate the fund’s portfolio. Several factors account for the country’s rally, including higher oil prices in recent years. Oil casts a long shadow over Russia’s economy, for good and ill, and at the moment those shadows tend to be positive. There’s also a growing perception that political risk has softened for Russia, if only slightly. “These big financial-sector sanctions that people were worried about — that never materialized,” Jacob Funk Kirkegaard, a senior fellow at the Peterson Institute for International Economics, opined last week.

CEE also holds stocks in Eastern Europe: Poland and Hungary are the second- and third-largest country weights at 14% and 10%, respectively, as of the end of this year’s first quarter. But Russia dominates with 67%.
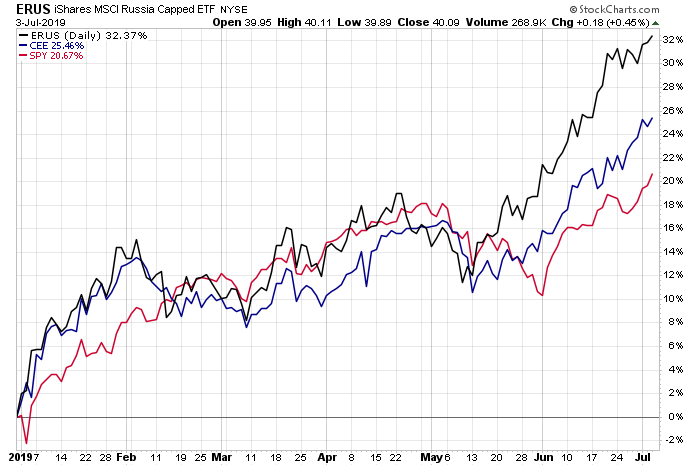
The bullish influence of Russia for CEE is clear when we compare the fund with iShares MSCI Russia (NYSE:ERUS), a Russia-focused ETF. In the chart below (which also includes SPDR S&P 500 (NYSE:SPY) for U.S. equity market perspective), ERUS’s blowout upside performance is conspicuous of late.

Russia/Eastern Europe is the regional leader for global equities year to date, but the rest of the field still looks impressive with solid across-the-board gains. Aside from CEE, year-to-date results range a 10.9% gain for Japan (NYSE:EWJ) to 20.7% for U.S. shares (SPY), the second-best regional performer.
The bullish tailwind on a global basis is anything but subtle these days, as a global equity market benchmark — Vanguard Total World Stock (NYSE:VT) – reminds. VT is up 18.1% so far in 2019, trailing only CEE and SPY.
The bears are warning that the rally is now vulnerable to a correction, in part because global growth has turned wobbly. Optimists counter that the trend has stabilized, or so it appears via survey data published this week. The J.P.Morgan Global Composite PMI, a proxy for worldwide gross domestic product (GDP), was unchanged at 51.1 in June. That’s just above the neutral 50 mark that separates growth from contraction.
Nonetheless, slow growth prevails, largely due to headwinds in manufacturing. The latest victim is Germany, where factory orders plunged in May. “The eagerly expected economic recovery in Germany is still nowhere to be seen,” advised Commerzbank’s Peter Dixon and Joerg Kraemer. “In addition to the weakness of the auto sector, this is attributable to weak demand from China, where the extensive stimulus measures have not yet had any effect.”
On a global basis, the manufacturing sector is in recession, according to the J.P. Morgan Global Manufacturing PMI. The index fell in June to 49.2, indicating contraction (below 50). The slump marks the lowest reading in seven years.
The US Manufacturing PMI is still indicating growth, but just barely. The index was essentially unchanged in June at 50.6, just slightly above the neutral 50 mark. “US manufacturers reported business conditions to have remained the toughest for nearly a decade in June,” says Chris Williamson, chief business economist at IHS Markit, which publishes the PMI data. “The past two months have seen the lowest readings since the height of the global financial crisis in 2009.”
For now, equity investors remain optimistic, or so this year’s strong rally in shares implies. But if manufacturing continues to weaken, and if the headwinds spill over to the service sectors, stocks that appear priced for perfection could take a hit.
“The danger is that the industrial slowdown impacts the labor markets and causes a more damaging consumer slowdown,” warns Roger Jones, head of equities at London & Capital, a wealth management firm. “Many investors are now justifiably concerned about the inverted yield curve and the implication this has for growth.”
