
Recent gaps in price action in the Russell 2000 ETF (NYSE:IWM) presents a clear picture of future price targets and support/resistances. Gaps are one of the most common forms of technical analysis techniques. They represent “voids” where price activity has skipped a range of price as it advances or declines aggressively.
Gaps are commonly used as targets for future price activity – where price attempts to “fill the gap”. In technical analysis theory, any gap that appears should eventually be “filled” by price in the future. Thus, any open gap that does not fill is still considered an “open target range.”
IWM Provides Unique Perspective
We're focusing on the Russell 2000 because we believe it provides a unique perspective on the markets related to the recent COVID-19 downside price swing and the recent recovery. The mid-cap market
sector tends to trend more quickly than the U.S. major indexes and can sometimes provide a clear picture of more true price trends.
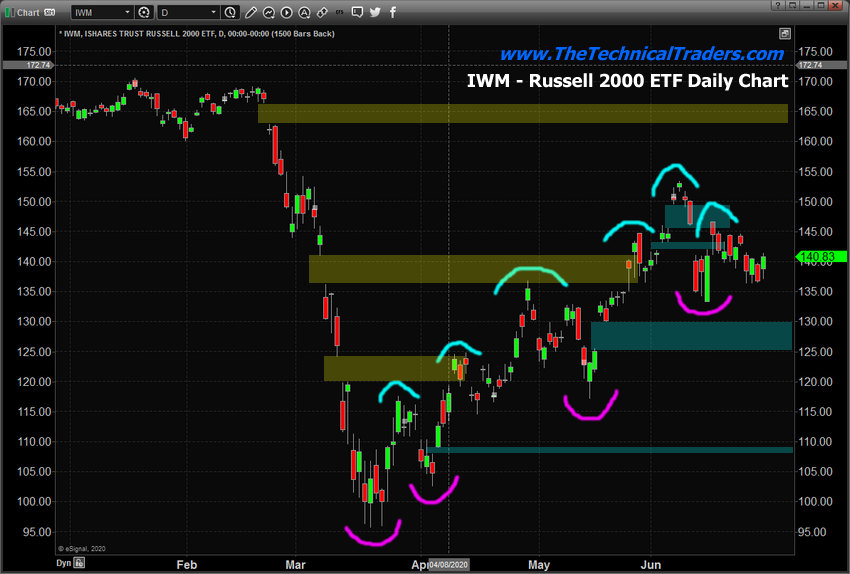
In this case, we've highlighted the downside price gaps in YELLOW and the upside price gaps in BLUE. Two of the downside price gaps have been filled recently as price advanced higher after March 21, 2020. Additionally, the two highest downside price gaps have also been filled – leaving the lower two still open (unfilled).
This presents a very easy to understand method of identifying future price targets for both bullish and bearish price trends. Either price will rally to fill the upper gap, near $163~166, or price will breakdown into a bearish trend attempting to fill the $125~130 gap or the $108~109 gap.
The recent low price level near $133.28 broke previous Fibonacci low price levels from May 29. Because of this, we believe the current trend is moderately bearish. We would like to see a new lower low setup to confirm this new trend. When we consider the next price move in the Russell 2000 ETF, two very clear targets become evident, either the recent upper BLUE gap range between $145~149 or
the lower BLUE gap range between $125~129.
IWM Weekly Chart
The IWM weekly chart does not illustrate the shorter term gap patterns as price volatility has consolidated into longer-term price bars. Still, we have to very clear gaps on the weekly IWM chart – the upper gap, near $163~166, and the lower gap, near $136~141. This lower price gap is currently acting as a support/resistance channel for the price as the IWM price consolidates within this range. A breakout/breakdown move is very likely as the future price trend will likely exit this gap range with an aggressive price move.
The lower gaps that are evident on the daily chart are still valid price levels on this chart. We’re just not seeing them on this weekly chart because of the compressed interval.
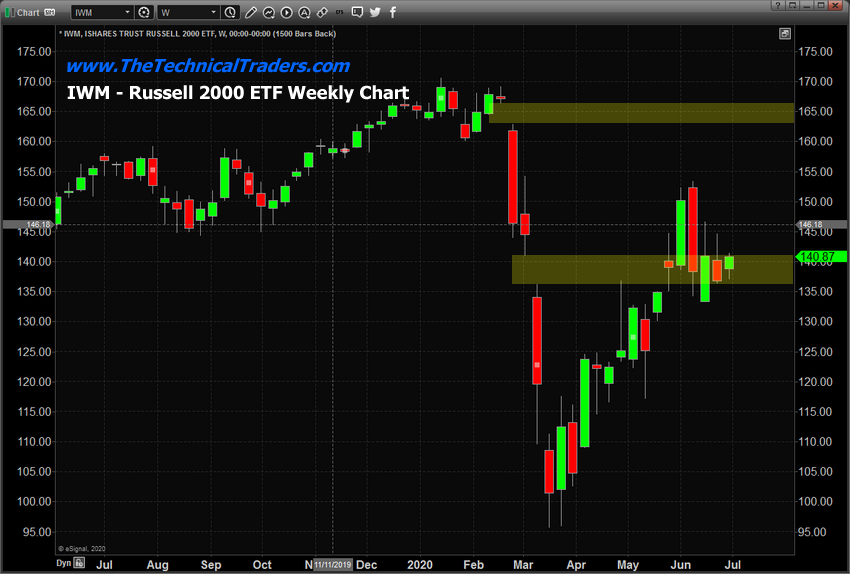
As we near the end of June 2020 (Q2), it is fitting that the IWM price level has stalled near this 50% Fibonacci retracement level and within the middle gap level. This level will likely continue to attract price as it consolidates before entering the breakout or breakdown trend. Again, based on the Fibonacci price theory, the recent low suggests the current trend is bearish.
The July 4 holiday weekend is nearing and prices tend to consolidate, absent any major news or earnings data, before any major holiday. Therefore, we may see price levels stay rather narrow this week as we await Q2 earnings and prior to the July 4 holiday. Stay properly protected in this market. Any breakdown/breakout move will likely happen very quickly in the near future.
In short, I hope you glean something useful from this article. If this is the start of a double-dip, it’s going to be huge, and if it’s the start of a bear market, it is going to be life-changing.