Get 40% Off
👀 👁 🧿 All eyes on Biogen, up +4,56% after posting earnings. Our AI picked it in March 2024.
Which stocks will surge next?
Unlock AI-picked Stocks

Russell 2000 Closes Week At New Swing High

Published 10/12/2020, 12:19 AM
Updated 07/09/2023, 06:31 AM

Friday was another day when Small Caps maintained their run of good form by closing above the August swing high, but buying volume was down from Thursday. Technicals remain net bullish and have been since before the mini breakout in October. The only downside was the 'black' candlestick—a higher open but lower close; a close above the prior day's close—'black' candlesticks at a swing high typically mark reversals, so it will be important for buyers on Monday to make a close above the high of this candlestick to negate its potentially bearish implications. 
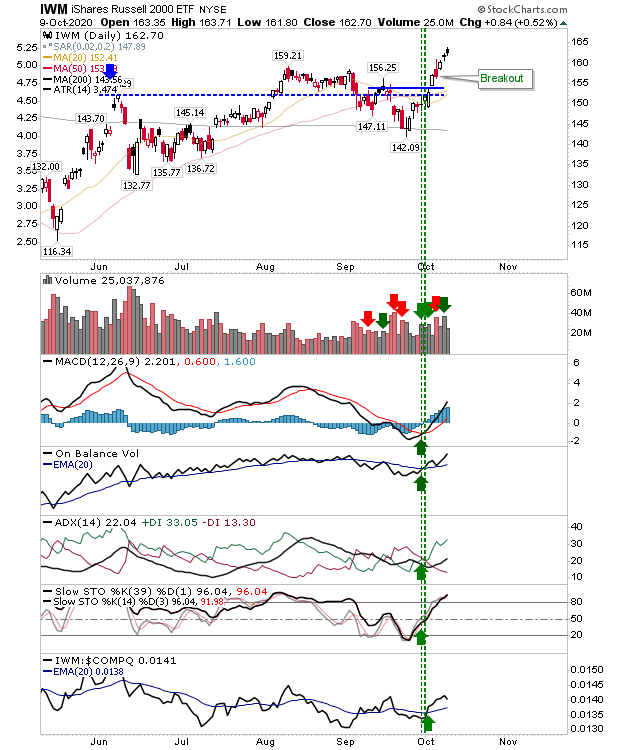
IWM Daily Chart

Both the NASDAQ and S&P continued to shape right-hand bases as they look to recover from the losses of August. The S&P remains in the 85% zone of historic price extremes relative to its 200-day MA and the NASDAQ is the 90% zone; both indices had reached the 95% zone in September. Even now, the Russell 2000 is only a fraction of a percentage point from getting into the 85% zone. These scenarios have in the past marked swing highs of consequence, but buyers are doing their best to ensure this will not be the case for a while yet.
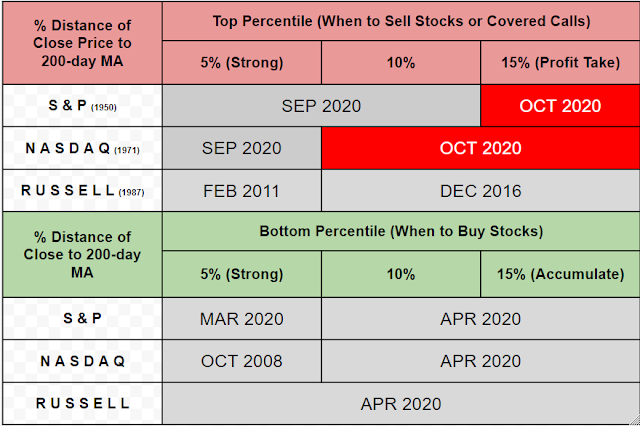
Swing Scenarios

The NASDAQ base formation follows after bears were unable to deliver on the measured move target (down) following the break of the 50-day MA. Technicals are all net bullish. With the quick return above the 50-day MA there is a good chance the rally will make it back to the late summer swing high.
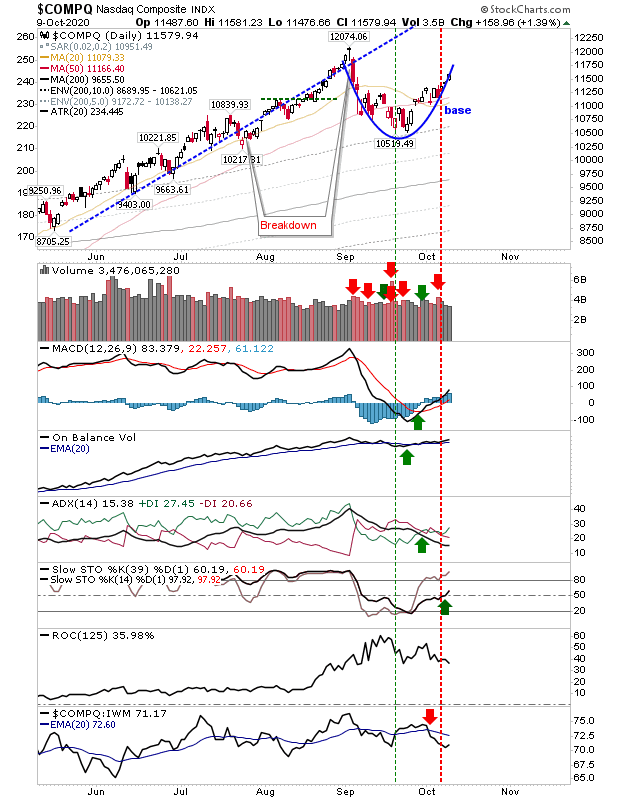
COMPQ_Daily Chart

3rd party Ad. Not an offer or recommendation by Investing.com. See disclosure here or remove ads .

The S&P didn't quite make it to its measured move target before it rallied, but it came close and the bounce has started to enjoy some higher volume accumulation—something the NASDAQ hasn't quite done yet. Despite this, the index is underperforming far more than the NASDAQ relative to the Russell 2000.
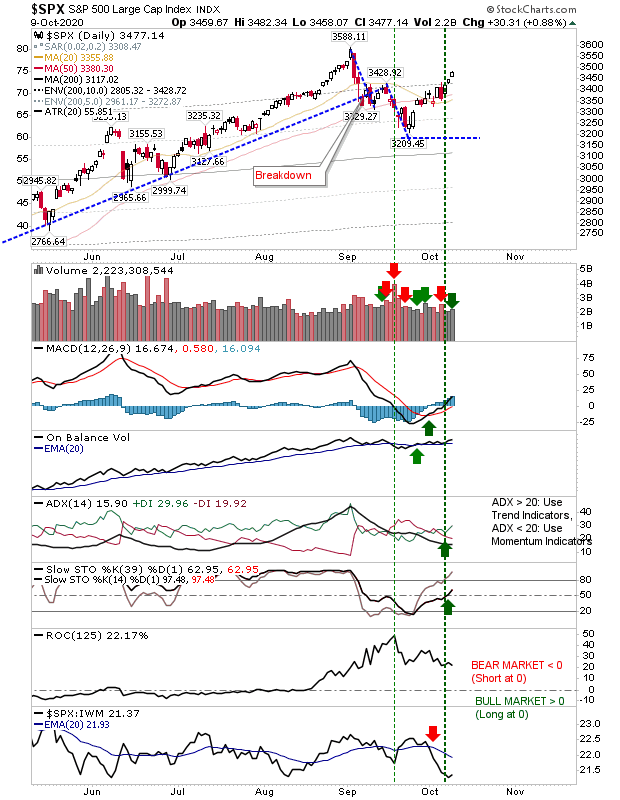
SPX Daily Chart

Breadth metrics continue to show improvement with the Percentage of NASDAQ Stocks above the 50-day MA advancing sharply from lows and beyond its declining channel.  The Percentage of NASDAQ Stocks above 50-day MA is enjoying a relative performance advantage over both the NASDAQ 100 and NASDAQ. 
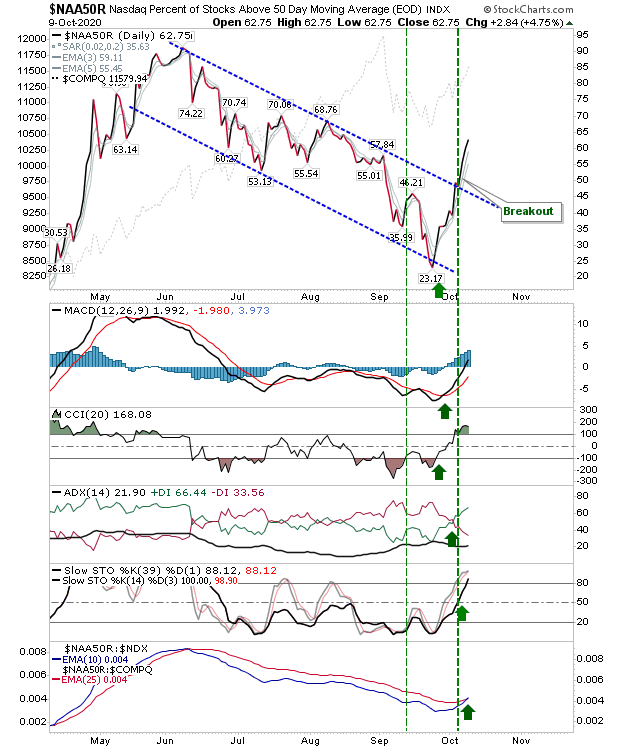
Breadth Metrics Daily Chart

I still see the last swing high as a major top of consequence but so far, indices are doing their best to put this to bed as indices build new bases with the Russell 2000 leading. Price action is key, but a Democratic victory—particularly if the Senate is won too—would likely turn into a sell the news event.

Latest comments

Thanks for your contribution
Risk Disclosure: Trading in financial instruments and/or cryptocurrencies involves high risks including the risk of losing some, or all, of your investment amount, and may not be suitable for all investors. Prices of cryptocurrencies are extremely volatile and may be affected by external factors such as financial, regulatory or political events. Trading on margin increases the financial risks.
Before deciding to trade in financial instrument or cryptocurrencies you should be fully informed of the risks and costs associated with trading the financial markets, carefully consider your investment objectives, level of experience, and risk appetite, and seek professional advice where needed.
Fusion Media would like to remind you that the data contained in this website is not necessarily real-time nor accurate. The data and prices on the website are not necessarily provided by any market or exchange, but may be provided by market makers, and so prices may not be accurate and may differ from the actual price at any given market, meaning prices are indicative and not appropriate for trading purposes. Fusion Media and any provider of the data contained in this website will not accept liability for any loss or damage as a result of your trading, or your reliance on the information contained within this website.
It is prohibited to use, store, reproduce, display, modify, transmit or distribute the data contained in this website without the explicit prior written permission of Fusion Media and/or the data provider. All intellectual property rights are reserved by the providers and/or the exchange providing the data contained in this website.
Fusion Media may be compensated by the advertisers that appear on the website, based on your interaction with the advertisements or advertisers.
© 2007-2024 - Fusion Media Limited. All Rights Reserved.