
Have you been paying attention to shares of Rudolph Technologies, Inc. (NYSE:RTEC) ? Shares have been on the move with the stock up 26.1% over the past month. RTEC hit a new 52-week high of $30.25 in the previous session. Rudolph Technologies has gained 26.36% since the start of the year compared to the 9.16% move for the Computer and Technology sector and the 15.09% year-to-date return for its peer group.
What's Driving the Outperformance?
The stock has an impressive record of positive earnings surprises, having beaten the Zacks Consensus Estimate in each of the last four quarters. In its last earnings report on February 1, 2018, Rudolph Technologies reported EPS of $0.29 versus the Zacks Consensus Estimate of $0.26 while it missed the consensus revenue estimate by 1.88%.
For the current fiscal year, Rudolph Technologies is expected to post earnings of $1.47 per share on $285.23 million in revenues. This represents a 34.71% change in EPS on a 11.81% change in revenues.
Valuation Metrics
While RTEC has moved to its 52-week-high in the recent past, investors need to be asking, what is next for the company? A key aspect of this question is taking a look at valuation metrics in order to determine if the company is due for a pullback from this level.
On this front, we can look at the Zacks Style Scores, as these give investors a variety of ways to comb through stocks (beyond looking at the Zacks Rank of a security). These styles are represented by grades running from A to F in the categories of Value, Growth, and Momentum, while there is a combined VGM Score as well. The idea behind the style scores is to help investors pick the most appropriate Zacks Rank stocks based on their individual investment style.
Rudolph Technologies, Inc. has a Value Score of D. The stock's Growth and Momentum Scores are A and C, respectively, giving the company a VGM Score of B.
In terms of its value breakdown, the stock currently trades at 20.54x current fiscal year EPS estimates. On a trailing cash flow basis, the stock currently trades at 24.19x versus its peer group's average of 17.05x. Additionally, the stock has a PEG ratio of 2.05. This isn't enough to put the company in the top echelon of all stocks we cover from a value perspective.
Rudolph Technologies, Inc. Price and Consensus
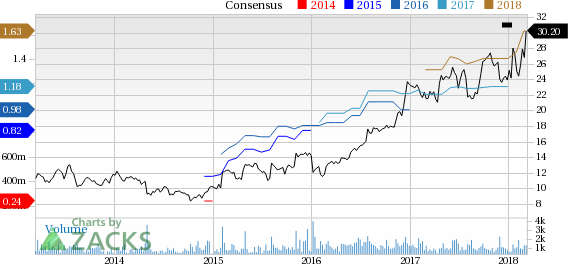
Rudolph Technologies, Inc. Price and Consensus | Rudolph Technologies, Inc. Quote
Zacks Rank
We also need to look at the Zacks Rank for the stock, as this supersedes any trend on the style score front. Fortunately, Rudolph Technologies, Inc. currently has a Zacks Rank of #2 (Buy) thanks to favorable earnings estimate revisions from covering analysts.
Since we recommend that investors select stocks carrying Zacks Rank of 1 (Strong Buy) or 2 and Style Scores of A or B, it looks as if Rudolph Technologies meets the list of requirements. Thus, it seems as though RTEC shares could still be poised for more gains ahead.
Rudolph Technologies, Inc. (RTEC): Free Stock Analysis Report
Original post
Zacks Investment Research