
Royal Caribbean Cruises Ltd. (NYSE:RCL) operates as a global cruise and vacation company. iven the strength and diversity of its brands and itineraries, this cruise operator has successfully captured the potential and repeat cruise vacationers.
The company’s North American products and Asia itineraries have been performing strongly over the past few quarters. Also, the company’s decision to invest in the fast-growing Chinese cruise markets is commendable. Going forward, strong booking and demand trends, technological innovation, capacity growth and various profit-generating initiatives are expected to drive growth.
However, higher marketing and promotional spend along with increased cruise costs has been hurting margins. Further, lingering global uncertainties coupled with negative currency translation has been limiting top-line growth.
Investors should note that the consensus estimate for RCL has hardly witnessed any significant movement over the last 60 days. Meanwhile, RCL’s earnings have been strong over the past few quarters. In fact, the company posted positive earnings surprises in each of the last four quarters, with an average beat of 22.26%. However, revenues lagged the Zacks Consensus Estimate in three of the trailing four quarters.
Royal Caribbean Cruises Ltd. Price and EPS Surprise
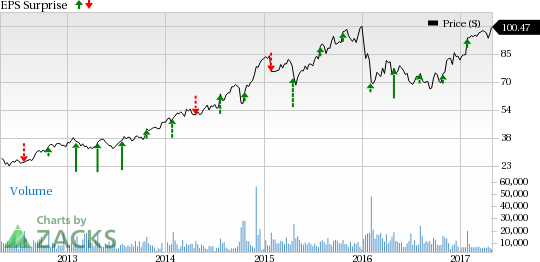
Royal Caribbean Cruises Ltd. Price and EPS Surprise | Royal Caribbean Cruises Ltd. Quote
RCL currently has a Zacks Rank #2 (Buy) but that could change following Royal Caribbean’s earnings report which was just released. You can see the complete list of today’s Zacks #1 Rank (Strong Buy) stocks here.
We have highlighted some of the key stats from this just-revealed announcement below:
Earnings: RCL beats on earnings. Our consensus earnings estimate called for earnings per share of 92 cents and the company reported earnings of 99 cents per share. Investors should note that these figures take out stock option expenses.
Revenues: RCL reported revenues of $2.01 billion. This lagged our consensus estimate of $2.02 billion
Key Stats to Note: On a constant currency basis, net yields were up 6% year over year, better than the guidance. Net cruise costs (NCC), excluding fuel decreased 4.4% on a constant currency basis almost in line with the guidance.
Stock Price Impact: At the time of writing, the stock price of Royal Caribbean was up over 3% during the pre-market trading hours following the earnings release.
Check back for our full write up on this RCL earnings report later!
The Best & Worst of Zacks
Today you are invited to download the full, up-to-the-minute list of 220 Zacks Rank #1 ""Strong Buys"" free of charge. From 1988 through 2015 this list has averaged a stellar gain of +25% per year. Plus, you may download 220 Zacks Rank #5 ""Strong Sells."" Even though this list holds many stocks that seem to be solid, it has historically performed 6X worse than the market. See these critical buys and sells free >>
Royal Caribbean Cruises Ltd. (RCL): Free Stock Analysis Report
Original post
Zacks Investment Research