Yet another bout of risk aversion during yesterday’s trading session saw USD/JPY continue its downward spiral, as well as the S&P 500’s amazing bullish run back to swing highs come to a halt.
Risk…
We have a fairly quiet trading day ahead to end the week, with the only tier one release being Canadian employment data. Let's take advantage of the quiet and use the time to take a look at the loonie.
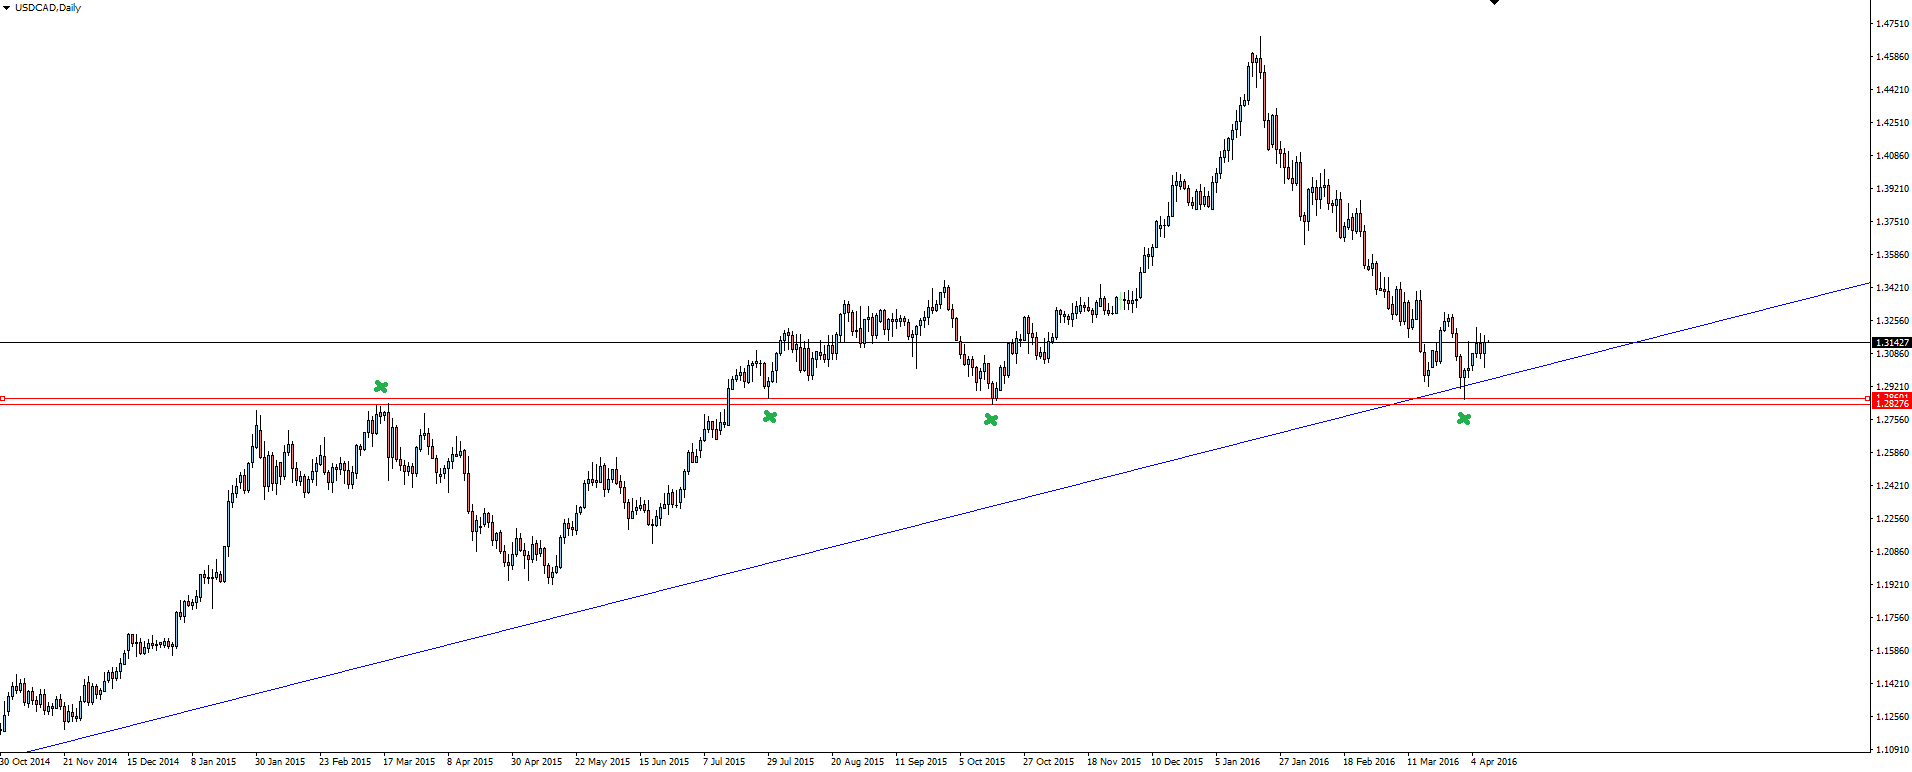
USD/CAD isn’t a chart we’ve looked at for a while and flicking through my MT4 watch-list (which I still haven’t cleaned up by the way…), I see this absolute GEM of setup.
USD/CAD Daily:
The most important part of the daily chart is the massive bullish trend that USD/CAD has been in since 2014, when that specific trend line started and even as far back as 2011 when the low came in.
Yes, I know that recently price has fallen 1700 pips in a straight line but it’s a massive bullish trend and in the context of the higher time frame charts, this really is just a healthy pull-back to support.
Support that you can see was touched basically to the pip!
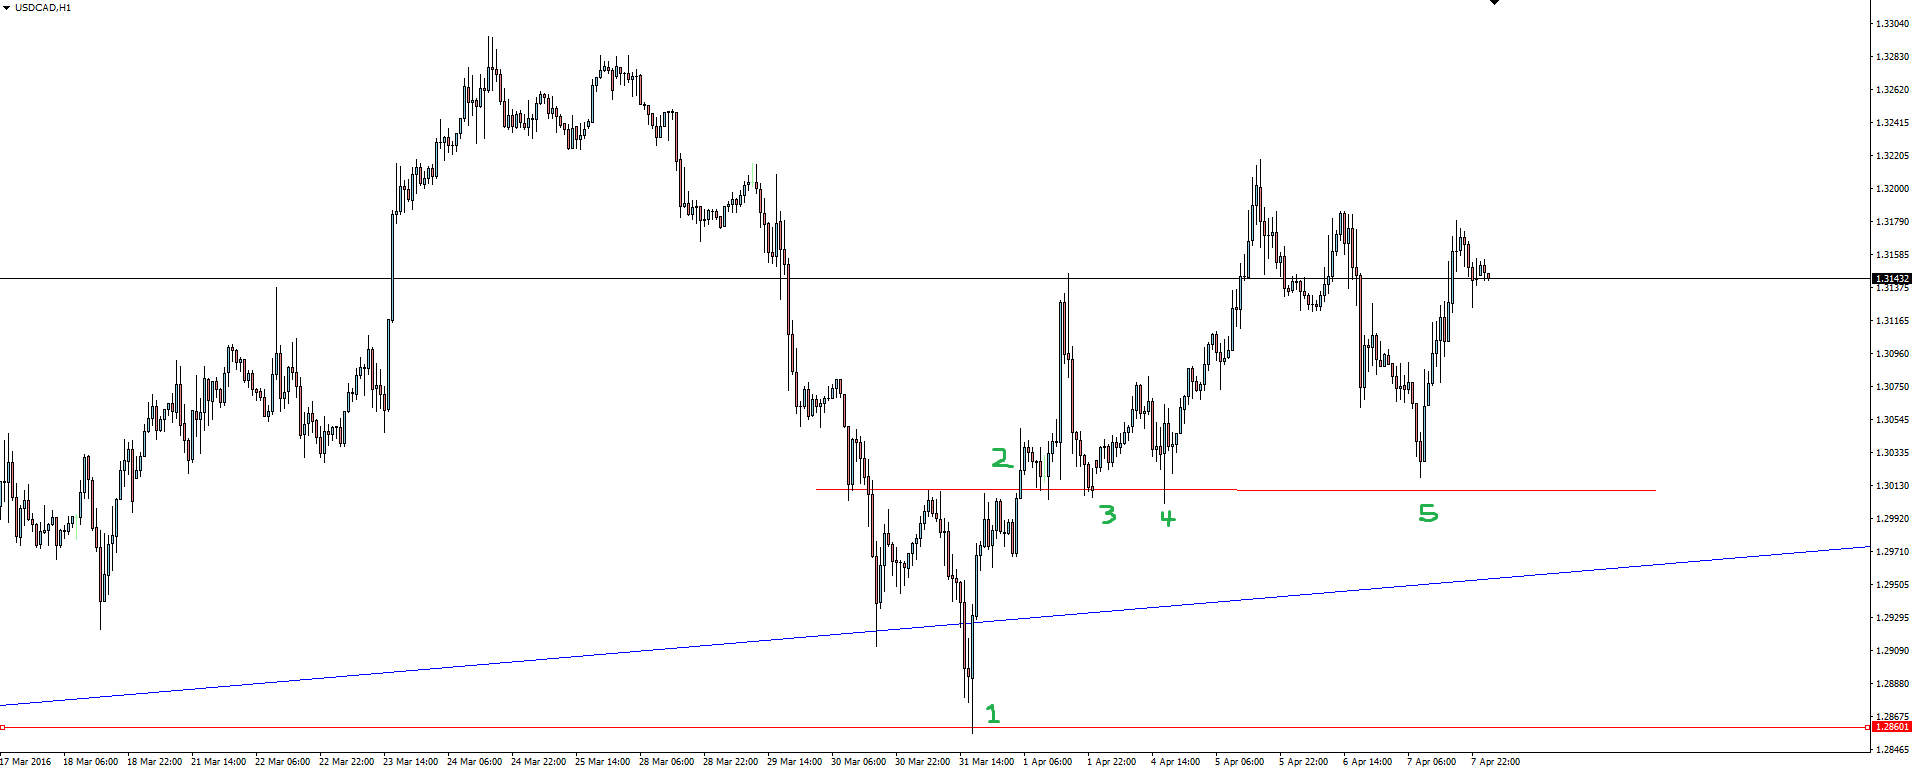
USD/CAD Hourly:
Zooming into the hourly, I put this here only as a hindsight trade to highlight taking entries on the lower time frame charts, in the context of a higher time frame bias.
1. The touch into higher time frame support + trend line confluence.
2. Break of the nearest swing high.
3, 4, 5. Re-test of this previous resistance level now turned support – Your entry level.
Did any of you trade this USD/CAD setup? Handle it differently?
Chart of the Day:
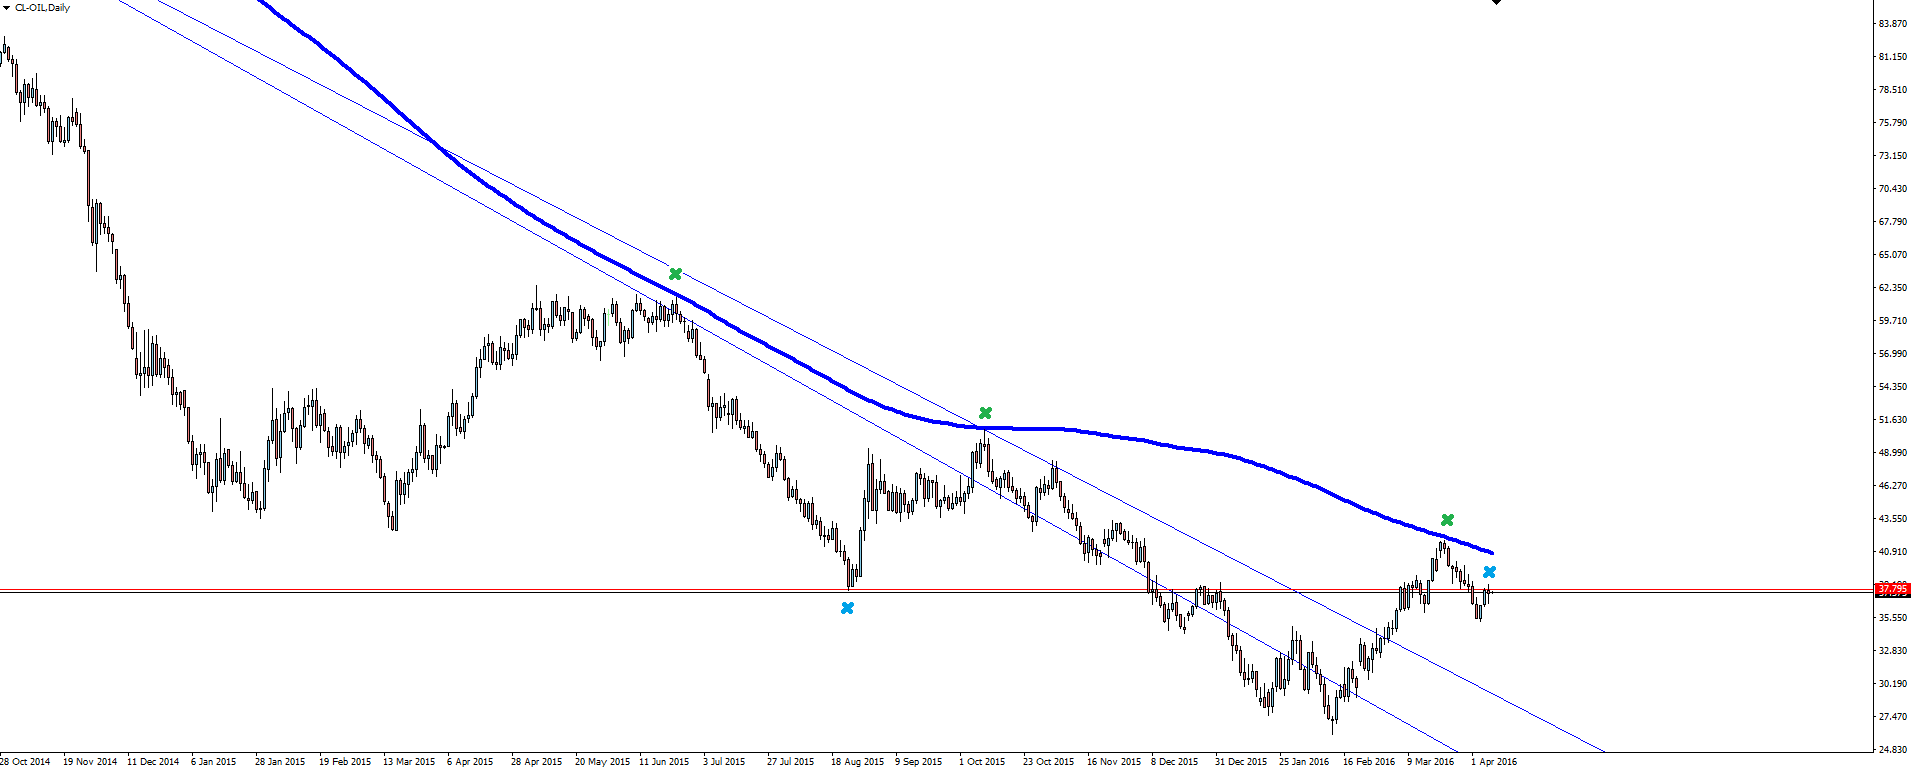
One for the commodities traders on our book with a look at oil.
Just before we broke for Easter, I posted a blog featuring the oil daily chart with a 200 SMA drawn in blue. As some of you filling up your cars with amazingly cheap petrol have surely noticed, dynamic resistance held for the third time and the price of oil has come back down.
This push back down saw price break the 37.80 resistance level and with price re-testing it again from the underside, opportunity could be there to sell this short term strength?
On the Calendar Friday:
GBP Manufacturing Production m/m
CAD Employment Change
CAD Unemployment Rate
Risk Disclosure: In addition to the website disclaimer below, the material on this page prepared by Vantage FX Pty Ltd does not contain a record of our prices or solicitation to trade. All opinions, news, research, prices or other information is provided as general news and marketing communication – not as investment advice. Consequently any person acting on it does so entirely at their own risk. The experts writers express their personal opinions and will not assume any responsibility whatsoever for the actions of the reader. We always aim for maximum accuracy and timeliness, and Australian Forex Broker Vantage FX on the MT4 platform, shall not be liable for any loss or damage, consequential or otherwise, which may arise from the use or reliance on this service and its content, inaccurate information or typos. No representation is being made that any results discussed within the report will be achieved, and past performance is not indicative of future performance.

