After yesterday's missive on "The Math Of Loss" I received quite a few emails and twitter comments questioning how a portfolio could be managed to avoid the "10-worst days." I expected some pushback from the article as it cuts against the grain of much of the commonly espoused views in the media and blogosphere. Here is the primary point:
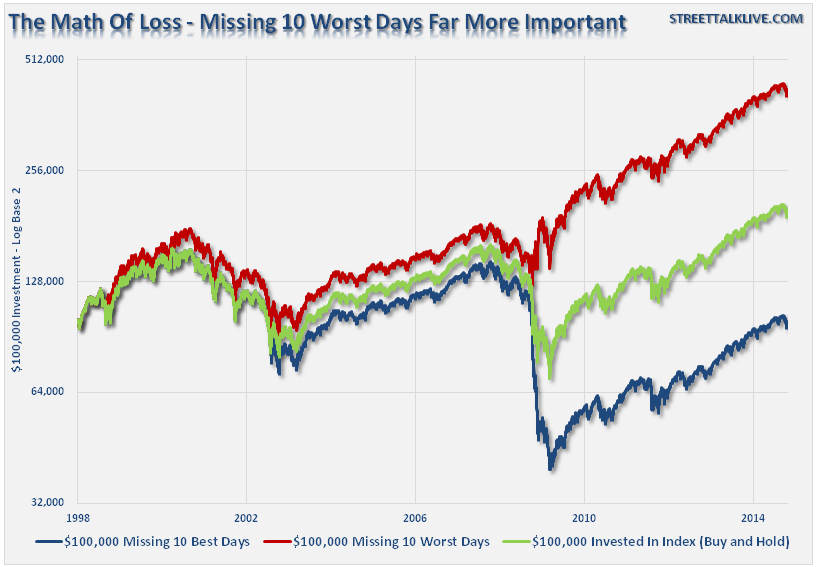
"The reason that portfolio risk management is so crucial is that it is not "missing the 10-best days" that is important, it is "missing the 10-worst days." The chart below shows the comparison of $100,000 invested in the S&P 500 Index (log scale base 2) and the return when adjusted for missing the 10 best and worst days."
"Clearly, avoiding major drawdowns in the market is key to long-term investment success. If I am not spending the bulk of my time making up previous losses in my portfolio, I spend more time compounding my invested dollars towards my long term goals."
In that article, I discussed a very simplistic model of portfolio risk management that showed how using a moving average crossover can help reduce the probability of capturing those all-to-important worst 10-days. Importantly, I discussed in the article several times that:
"I completely agree that investors can not be 'all in' or 'all out' of the market on a consistently correct basis."
These two comments seem, on the surface, to be contradictory which was the source of the many comments I received yesterday. How can one miss the 10-worst days of the market without being completely "out" of the market? The answer is you cannot, but you also cannot "time" the market efficiently enough to get "back in" to capture the 10-best days of the market.
What can be efficiently and consistently done, is managing the inherent portfolio risk to minimize the damage incurred by capturing the bulk of the major market corrections over the long-term. What is missed by the "buy and hold" crowd is the realization that in order to "beat the market" over the long term, it is not outperforming when markets are rising but when markets are falling that matters most.
So, the obvious question, is how would an investor do that?
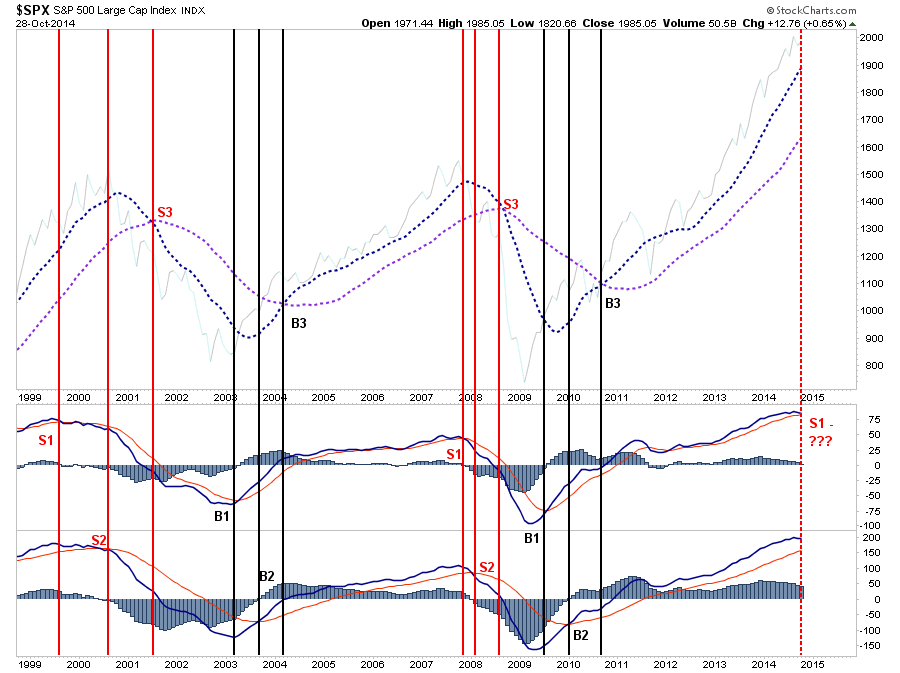
In order to answer that I have created a simplistic technical model that will generate three separate "buy/sell" signals. This model will use a short-term moving average convergence/divergence indicator (MACD), an intermediate-term MACD and a long-term moving average crossover. (Notice that each signal requires more time to be triggered which in theory should keep portfolios more allocated to the markets as trends rise and vice-versa)

(Note: I don't want to get in a long debate about signal construction, so I have removed the indicator parameters. The concept of managing portfolio risk is the point I wish to clarify, and I am not recommending any particular methodology or strategy. As with all things, past performance is no guarantee of future results.)
The chart above is based on monthly data to reduce the "noise" of daily and weekly market action. By using a longer time frame with the model, it not only reduces portfolio turnover and the related expenses, but also keeps portfolios allocated according to the overall trend of the market.
The labels are the buy and sell signals generated by the three different price movement indicators. S1 is the first sell signal and B1 is the first buy signal. As shown in the chart below each signal triggers a portfolio reallocation of 25%. For the purpose of this exercise, I am using a portfolio that is simply allocated 100% to the Vanguard S&P Index Fund.
As each "sell signal" is triggered, as the trend in market changes from positive to negative, the portfolio is reduced by 25% allowing investors to "sell high."
Importantly, notice that the portfolio is NEVER allocated 100% to cash regardless of how badly the overall market is doing. The reasoning for this is that it truly is "impossible to time the market" consistently. Emotional biases keep investors from adhering to a strict discipline over time, however, by keeping a small allocation to equities at all times provides a "base" from which to build off of.
As the preceding negative trend ultimately changes back to a positive slope, the cash raised during the correction is then used to begin "buying low."
Here was a comment given on yesterday's post:
"It is impossible to only miss the 10-worst days. If you are out of the market, your returns will be less over time."
This is a partially true statement. It is indeed impossible to ONLY miss the 10-worst days. However, the second part of the statement is entirely false.
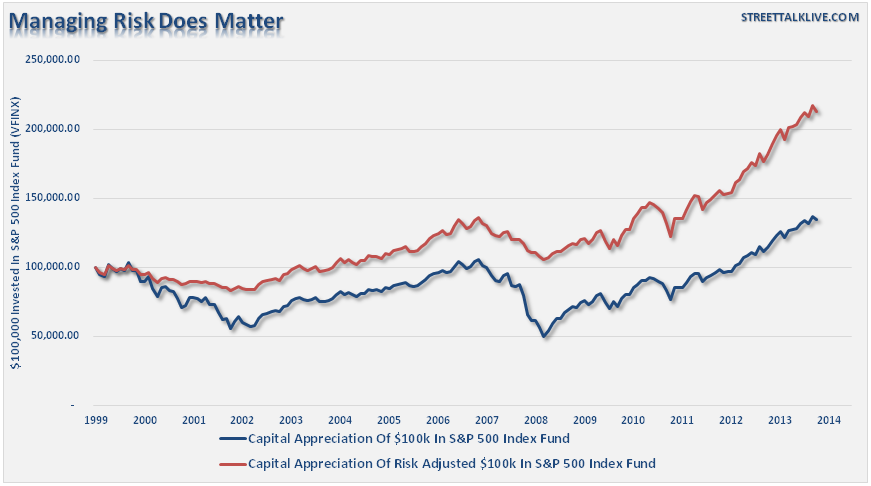
The chart below shows a $100,000 investment in the Vanguard S&P 500 Index (VFINX) on a capital appreciation only basis. The red line shows the same $100,000 investment using the portfolio risk management thesis described above.
What is clear is that while the portfolio may have missed some of the 10-best days of the market, it also missed many of the 10-worst days as well. Over time, it was the preservation of capital the inured to the benefit of portfolio performance over a strict "buy and hold" philosophy. In other words, "buying low and selling high" does matter.
While the concept is simple to comprehend, it is difficult to implement due to the emotional biases of "fear" and "greed." As shown in the buy/sell signal chart above, can you imagine being told to reduce your portfolio by 25% in 1999, or in 2007? The always bullish media was blathering about a "goldilocks economy" and giving reasons why "this time is different than the last."
However, it is important to remember that markets do operate in full cycles. What goes up will eventually come down, and there is truth to the saying that "the higher they rise, the further they fall."


