
EU sovereign debt spreads widened once again today, herding the bulls toward the exits. But then we saw yet another batch of positive US data. Is the risk glass half full or half empty here?
Euro Debt Woes
Another day with Euro sovereign debt woes in the spotlight today as Italy’s new PM Monti faced political difficulties over the formation of his cabinet and Spain was unable to auction off as many 12- and 18-month bills as it hoped to, coming up a few hundred million short of the full target. Most EU debt spreads rushed to new wides versus Germany as the sovereign debt crisis continues to burn. Italian 10-years also traded above 7.0% again at one point after the yield had dipped to as low as 6.35% yesterday.
Odds and ends
The German ZEW survey notched another brutally ugly reading in November, pushing to its lowest level (-55.2) since late 2008. This survey of economic growth expectations was fairly prescient the last time around in predicting a weak period for the German economy and despite Germany’s impressive 2.5% YoY GDP reading for Q3, some of the more leading data suggests a rather drastic deceleration is now taking place in Q4.
The UK CPI was released today without much fanfare, coming in slightly below expectations on the headline, though slightly above on the core at 3.4%. That’s a rather high number and not at all GBP bullish, considering the negative interest implications when overnight rates are at 0.50% and with the assumption that the BoE will look through almost any inflation level for now. Sterling is its usual “inbetween” self when the Euro is suffering – stronger than the single currency but far weaker than the USD or JPY. The 0.8500 level in EURGBP is an important support level, with interesting implications if it is taken out.
The pattern for the JPY remains similar to previous market cycles, as the currency, the MoF/BoJ efforts notwithstanding, simply can’t avoid strengthening in distinctly risk off markets. USDJPY is back testing below 77.00 as of this writing after a spike in the Asian session and the likes of NZDJPY and CADJPY are getting fairly hammered in the last couple of days. Tonight will be the second day of the Bank of Japan meeting. The market doesn’t seem to respond to BoJ easing, only MoF helicopter drops of JPY, but stay tuned on that front as the sub-77 zone likely doesn’t sit well with the government.
Yesterday, I wrote a bit about the FOMC’s Evans and his support of further stimulus and even the use of the nuclear option of NGDP targeting. He was out speaking again today in what appears to be a relatively repeat of other recent speeches (in favor of more stimulus in an effort to bring down unemployment, even if it means uncomfortably high inflation for a time). The contents of the speech were perhaps less interesting than the comment that his views on stimulus were “unusual” on the FOMC. This didn’t get any market reaction, but it’s interesting as it suggests perhaps that the Fed is farther away from a more aggressive stance than is currently imagined.
Another batch of positive US data today, with Retail Sales ex Gas and Autos handily beating expectations with a +0.7% MoM surge. The Empire Manufacturing data, the most consistently weak of regional manufacturing surveys, meanwhile, notched a marginally positive +0.61 vs. the -2.0 expected. The core PPI, while notching a 0.0% reading for the month-on-month figure, saw the core surging +2.8% year-on-year, the most in two years.
Chart: USD/CAD
USDCAD surged higher toward the top of the range today before turning tail back into the range on a surge in risk appetite from positive US data and on a positive Canadian manufacturing sales data ahead of the US equity market open. Will the range hold once again as it did on the last two attempts through the 1.0225 area, or is the greenback ready to take on all comers again? Note the support from the 55-day moving average (red line).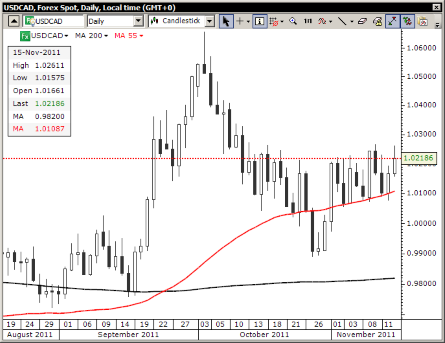
- English (UK)
- English (India)
- English (Canada)
- English (Australia)
- English (South Africa)
- English (Philippines)
- English (Nigeria)
- Deutsch
- Español (España)
- Español (México)
- Français
- Italiano
- Nederlands
- Português (Portugal)
- Polski
- Português (Brasil)
- Русский
- Türkçe
- العربية
- Ελληνικά
- Svenska
- Suomi
- עברית
- 日本語
- 한국어
- 简体中文
- 繁體中文
- Bahasa Indonesia
- Bahasa Melayu
- ไทย
- Tiếng Việt
- हिंदी
Risk Glass Half Full Or Half Empty?
Published 11/15/2011, 01:18 PM
Updated 03/19/2019, 04:00 AM
Risk Glass Half Full Or Half Empty?
3rd party Ad. Not an offer or recommendation by Investing.com. See disclosure here or
remove ads
.
Latest comments
Install Our App
Risk Disclosure: Trading in financial instruments and/or cryptocurrencies involves high risks including the risk of losing some, or all, of your investment amount, and may not be suitable for all investors. Prices of cryptocurrencies are extremely volatile and may be affected by external factors such as financial, regulatory or political events. Trading on margin increases the financial risks.
Before deciding to trade in financial instrument or cryptocurrencies you should be fully informed of the risks and costs associated with trading the financial markets, carefully consider your investment objectives, level of experience, and risk appetite, and seek professional advice where needed.
Fusion Media would like to remind you that the data contained in this website is not necessarily real-time nor accurate. The data and prices on the website are not necessarily provided by any market or exchange, but may be provided by market makers, and so prices may not be accurate and may differ from the actual price at any given market, meaning prices are indicative and not appropriate for trading purposes. Fusion Media and any provider of the data contained in this website will not accept liability for any loss or damage as a result of your trading, or your reliance on the information contained within this website.
It is prohibited to use, store, reproduce, display, modify, transmit or distribute the data contained in this website without the explicit prior written permission of Fusion Media and/or the data provider. All intellectual property rights are reserved by the providers and/or the exchange providing the data contained in this website.
Fusion Media may be compensated by the advertisers that appear on the website, based on your interaction with the advertisements or advertisers.
© 2007-2024 - Fusion Media Limited. All Rights Reserved.