Risk sentiment remained supported yesterday, with Nasdaq hitting a new record high. It seems that investors remained optimistic that China’s policy steps would relieve pressure on the economy from the coronavirus. In the FX world, the Kiwi was among the gainers, but mainly due to the risk-on trading environment rather than New Zealand’s employment report. As for today, USD-traders are likely to pay attention to the ISM non-manufacturing PMI and the ADP employment report, both for January.
RISK ASSETS CONTINUE TO GAIN DUE TO CHINA’S POLICY
The dollar traded mixed against the other G10 currencies on Tuesday and during the early Asian morning Wednesday. It gained against JPY, CHF and EUR in that order, while it underperformed versus SEK, AUD, NOK and NZD. The greenback was found virtually unchanged against GBP and CAD.
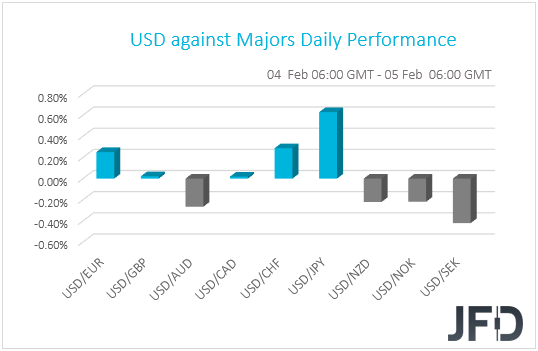
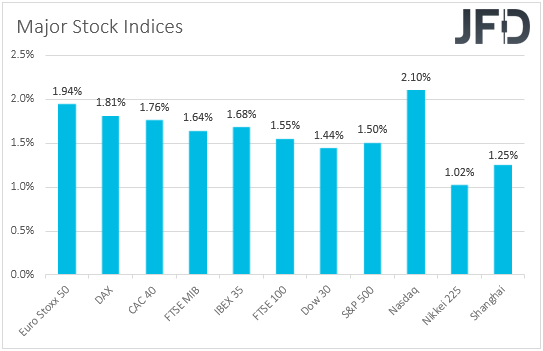
The weakening of the safe havens yen and franc and the strengthening of the commodity-linked Aussie and Kiwi suggest that risk appetite remained supported for the second consecutive day. Indeed, major EU and US indices were a sea of green, with Nasdaq hitting a new record high, while the S&P 500 and the DJIA notched their biggest daily gains in six and five months respectively. The upbeat mood rolled over into the Asia session today as well, with Japan’s Nikkei 225 and China’s Shanghai Composite rising 1.02% and 1.25% respectively.
Although the fast spreading of the coronavirus continues, with the death toll rising to 493 and the confirmed cases surging to 24531, investors kept increasing their risk exposure, perhaps due to optimism that China’s policy steps would relieve pressure on the economy from the virus. On Monday, the PBoC lowered interest rates on reverse repurchase agreements, the seven-day reserve repo rate and the 14-day tenor, all by 10 bps, while up until yesterday, it injected a total of 1.7 trillion yuan into the market via reserve repos. What’s more, sources said that the Bank is likely to lower its loan prime rate on February 20th, and also cut the reserve requirement ratios in the weeks to come.
It seems that investors have started putting some faith on China’s steps to prevent the virus from badly harming economic activity, but we are still reluctant to say that the worst is behind us. They may continue diverting flows from safe havens to riskier assets for a while more, but with the virus spreading at an exponential pace, we hesitate to call for a long-lasting recovery. We prefer to wait for news and headlines that the virus has been really contained before we start assuming that the euphoria will last for long. Many believe that the virus will affect both Chinese and global economic activity in Q1, but they also believe that the blow will be short. However, with no signs that the virus could be stopped soon, further spreading may raise concerns of an even more serious impact, and if this continues for a few more weeks, the economic wounds could well drag into Q2.
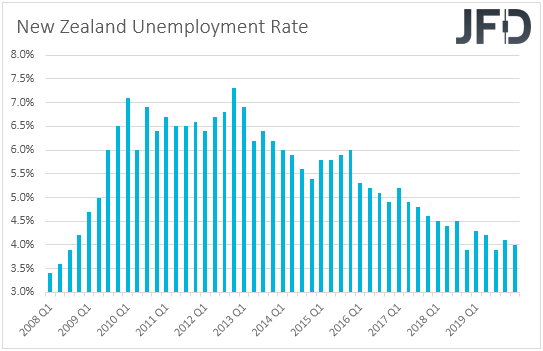
Back to the currencies, the Kiwi was among the gainers, mainly getting benefited by the broader market sentiment rather than New Zealand’s employment data overnight. The unemployment rate ticked down to 4.0% from a downwardly revised 4.1%. However, given that the employment change revealed no new added jobs, the decline in the unemployment rate may have not been for the good reasons. Indeed, with the participation rate sliding to 70.10% from 70.40%, the slide in the unemployment rate may be owed to many people being discouraged to register as unemployed and seek for a job.
At its latest meeting, the RBNZ surprised investors, who were largely pricing in a rate cut, and instead decided to stand pat. That said, officials maintained their easing bias, saying that they will add further monetary policy stimulus if needed. Back then they noted that employment remains around its maximum sustainable level and thus, combined with the acceleration in the nation’s CPI rate to 1.9%, just a tick below the midpoint of the Bank’s target range of 1-3%, a not so disappointing employment report may allow policymakers to wait for a while more before they decide to cut. Having said all that, the big risk to that view is the fast-spreading coronavirus which could have a negative impact on New Zealand’s economy. Let’s not forget that New Zealand is one of China’s main trading partners.
NZD/JPY – TECHNICAL OUTLOOK
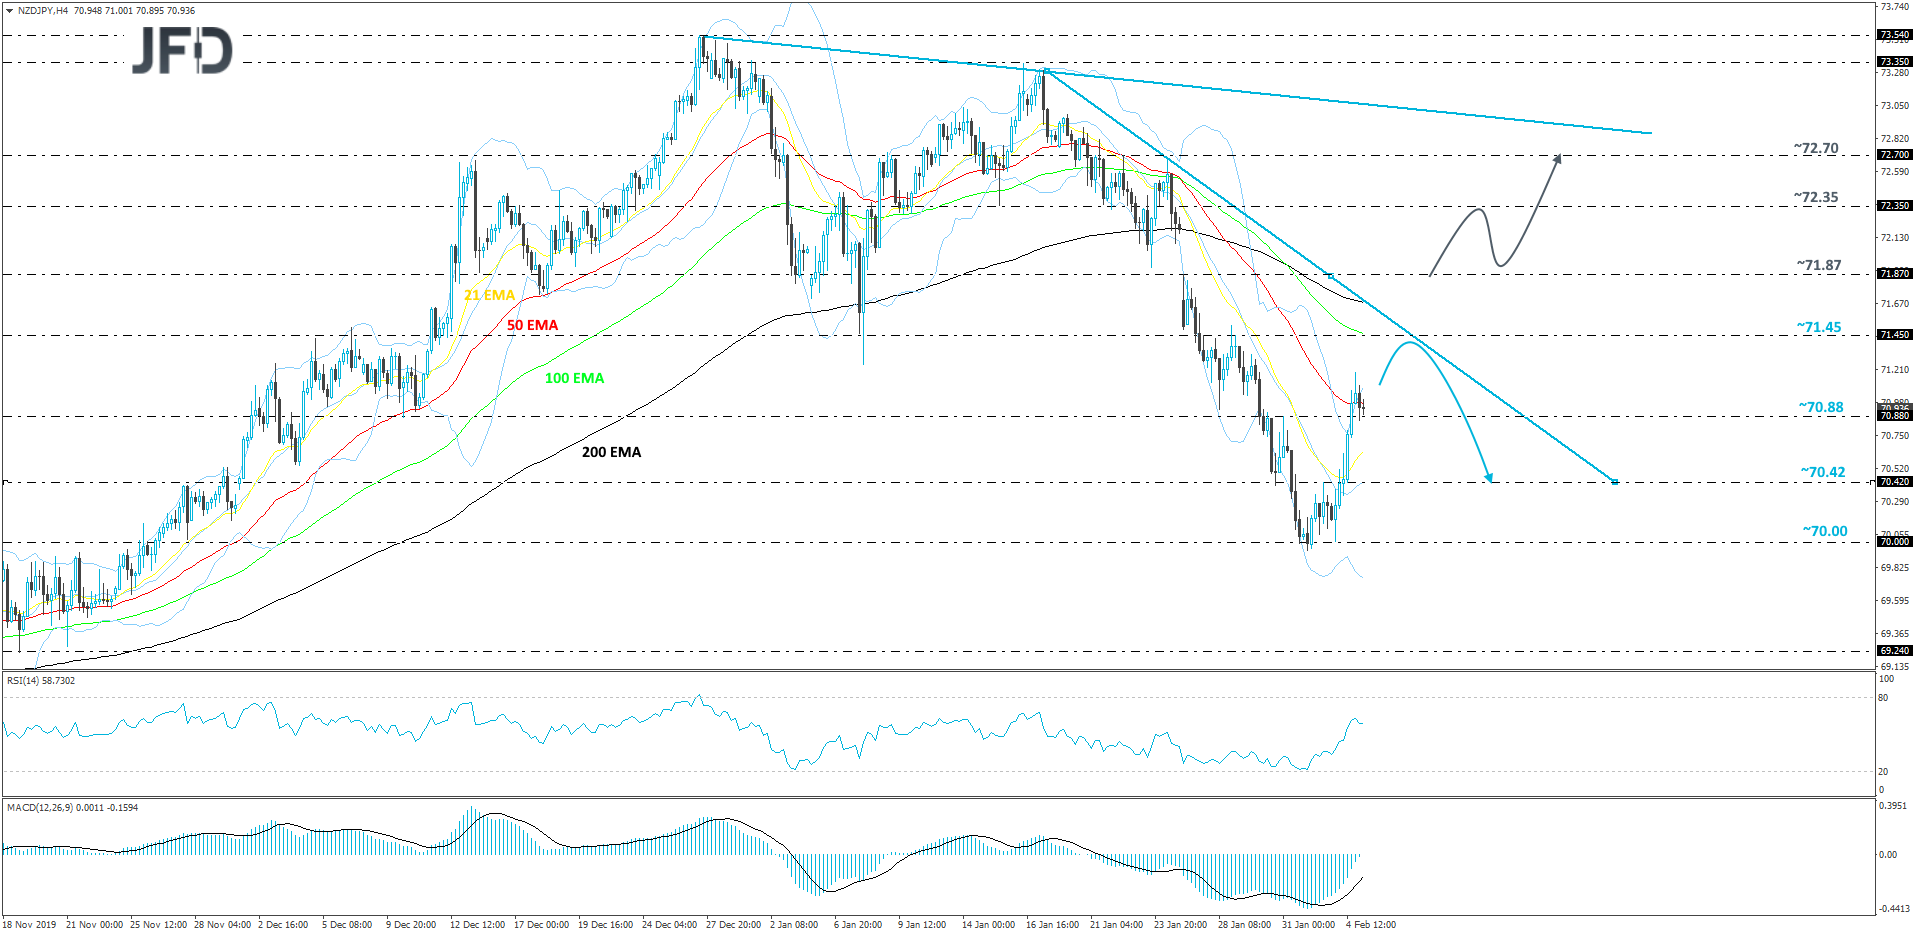
Although NZD/JPY continues to trade below its short-term tentative downside resistance line drawn from the high of January 17th, recently, the bulls have been very active by trying to push the rate back to that downside line. There is still a bit of room left until that line could get tested, but if the pair fails to break and stay above it, this may lead to another round of selling. That is why, overall, we will remain somewhat bearish, at least for now.
There is good likelihood that the rate could continue drifting north up until it might hit the aforementioned downside line, which if remains intact, could attract the sellers back into the game. If so, NZD/JPY may slide back to the 70.88 hurdle, which is the high of January 31st, a break of which could clear the path to some lower areas. One of those areas might be the 70.42 level, marked by an inside swing high of February 3rd.
Alternatively, if the above-discussed downside line breaks and the rate climbs above the 71.87 barrier, marked by the high of January 26th, this would also place the pair above its 200 EMA on the 4-hour chart and more buyers could join in. That’s when we will target the 72.35 obstacle, a break of which may set the stage for a push to the 72.70 level, marked by the high of January 22nd. Slightly above it runs another short-term tentative downside line, which could provide additional resistance to NZD/JPY and keep it down for a bit.
ISM NON-MANUFACTURING PMI AND ADP (NASDAQ:ADP) REPORT ON TODAY’S AGENDA
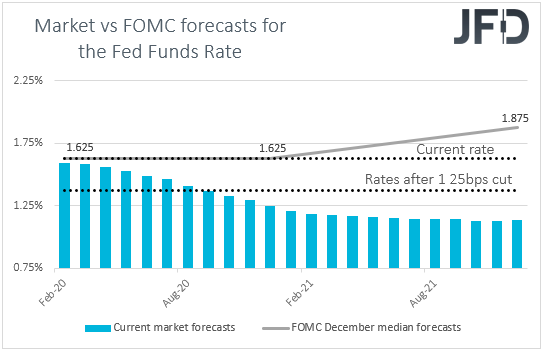
Flying back to the US and the dollar, today its traders may pay attention to the ISM non-manufacturing PMI for January, as well as to the ADP employment report for the month. The ISM index is expected to have held steady to 55.0, which combined with the positive surprise in the manufacturing print on Monday and a potentially decent employment report on Friday may allow market participants to push further back the timing of when they expect another cut by the Fed. According to the Fed funds futures, investors have already pushed that action back yesterday, from July to September, perhaps due to expectations that China’s steps will not allow the virus to weigh much on other economies.
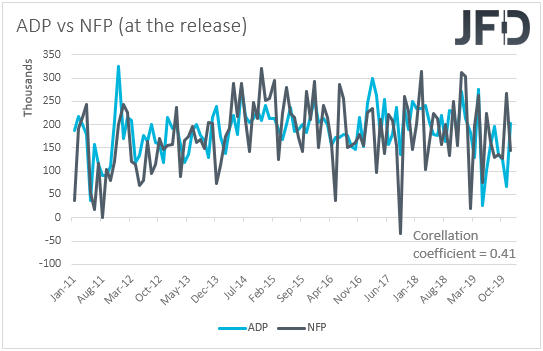
Now with regards to the ADP report, it is expected to show that the economy has gained 156k jobs, less than the 202k job gain in December. This may raise speculation that the NFP print, due out on Friday, may come slightly below its forecast of 160k. However, bearing in mind that the correlation between the two time-series has fallen in recent years, we believe that the ADP is far from a reliable predictor of the NFP number. Even last month, the ADP (NASDAQ:ADP) accelerated to 202k from 124k, but the NFPs slowed to 145k from 256k. Taking data from back in January 2011, the correlation of those time series (no revisions are taken into account) is now standing at 0.41. The ISM non-manufacturing PMI for January and the nation’s trade balance are also coming out.
EUR/USD – TECHNICAL OUTLOOK
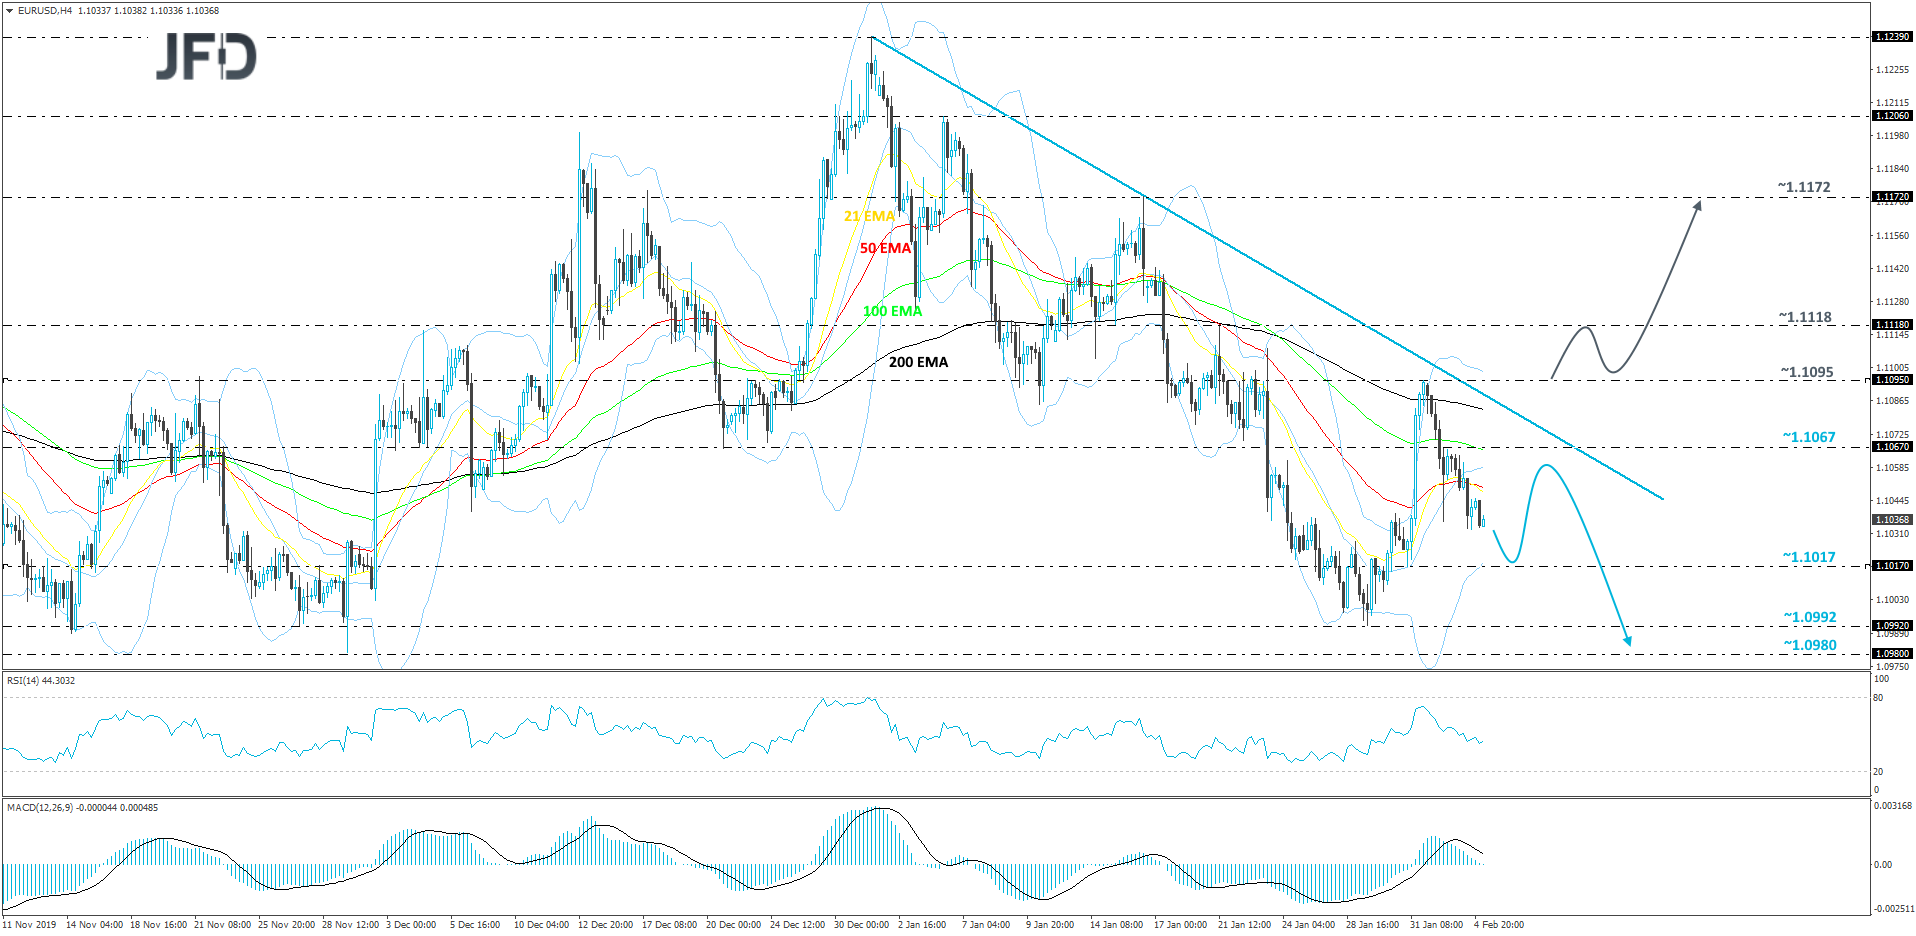
After almost testing the short-term tentative downside line taken from the high of December 31st, EUR/USD reversed back to the downside and seems to have set sail towards January low. The RSI and the MACD seem to be supporting the idea of seeing a bit more downside, as the RSI is below 50 and the MACD is below its trigger line, and has moved fractionally below zero. Therefore, as long as the pair remains below the above-mentioned downside line, we will continue aiming lower.
Another small slide could bring EUR/USD to the 1.1017 hurdle, marked by the low of January 31st, which may provide temporary support for the pair. If so, the rate might rebound and make its way a bit higher. That said, if it stays below the aforementioned downside line, this could trigger another round of selling, possibly bringing EUR/USD below the 1.1017 zone and targeting lower areas. That’s when we will aim for the 1.0992 hurdle, which is the lowest point of January, or for the 1.0980 level, marked by the lowest point of November, 2019.
In order to shift our view to the upside, we would first like to see a break of the previously mentioned downside line and a push above the 1.0995 barrier, marked by the high of last week. More bulls may see this as a good opportunity to join in, as such a move would confirm a forthcoming higher high. That’s when the rate may rise to the 1.1118 obstacle, a break of which could open the door for a move to the 1.1172 level, marked by the high of January 16th.
AS FOR THE REST OF TODAY’S EVENTS
During the European morning, we get the final services and composite PMIs from the Eurozone and the UK. Again, the final prints are expected to confirm their preliminary estimates. Eurozone’s retail sales for December are also due to be released. The mom rate is expected to have declined to -0.5% from +1.0%, but this will push the yoy rate up to 2.5% from 2.2%.
In the US, apart from the ISM non-manufacturing PMI and the ADP report for January, we get final Markit services and composite PMIs for the month, as well as the trade balance for December. The final Markit prints are expected to confirm their initial numbers, while the nation’s trade deficit is anticipated to have widened to USD 48.20bn from USD 43.10bn. Canada’s trade data for December are also due to be released, with this nation’s deficit expected to have narrowed.
With regards to the energy Market, we get the EIA (Energy Information Administration) weekly report on crude oil inventories for last week, which is expected to reveal a 2.831mn barrels increase, a slowdown from 3.545mn barrels the week before. That said, bearing in mind that the API (American Petroleum Institute) reported a 4.180mn inventory build, we see the risks surrounding the EIA forecast as tilted somewhat to the upside.
As for tonight, during the Asian morning Thursday, markets in New Zealand will be closed in celebration of the National Day. From Australia, we have trade and retail sales figures, both for December. The nation’s trade surplus is expected to have increased, while retail sales are anticipated to have declined 0.2% after rising 0.9% in November. However, this will push the qoq rate for Q4 up to 0.3% from -0.1%.
We also have three speakers on today’s agenda: ECB Vice President Luis De Guindos, BoC Senior Deputy Governor Carolyn Wilkins, and FOMC Board Governor Lael Brainard.
