Get 40% Off
💰 Buffett reveals a $6.7B stake in Chubb. Copy the full portfolio for FREE with InvestingPro’s Stock Ideas toolCopy Portfolios

Semiconductor Index Downturn May Not Be Over Just Yet

Published 12/14/2017, 10:05 AM
CL
-
SOX
-

Coming into year end, the equity markets are at all-time highs, the crypto markets are acting like super heroes and oil is holding up at 52 week highs. Everything is great. Except for the chip stocks.

Don’t get me wrong, the Semiconductor Index (SOX) has had a great 2017. But the last three weeks the SOX has looked like it blew a hole out when they were putting on their socks on a snowy morning.

The SOX has pulled back over 15% in that time. Is it temporary?

The chart below gives some place and price levels to watch to help figure this out. Measuring the move from the September pullback to the peak in November sets the range. Since then it has retraced 61.8% of the move higher and crossed down below the 50 day SMA. A bounce last week brought it back to the 50 day SMA and the 38.2% retracement level where it stalled and reversed. Now it is back lower at a 50% retracement of the move up.
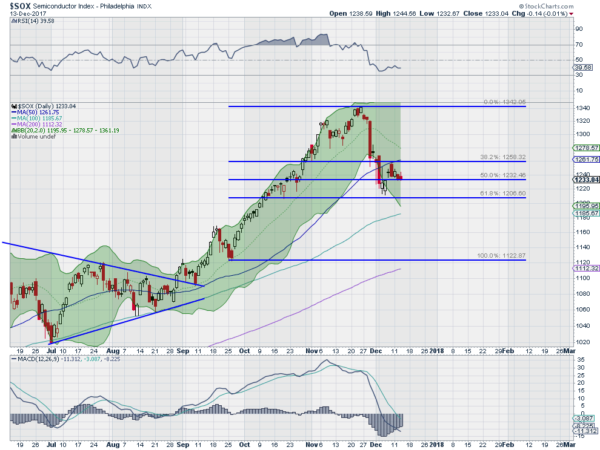
SOX Daily Chart

This creates a lower high if it does not reverse. A sign that the downturn is not over. A move below the 61.8% retracement at 1206 would confirm that with a lower low and look for continuation to 1122.

Notice that momentum turned bearish but never went extreme. That also bodes for more downside. The RSI has leveled in bearish territory while the MACD is slowing its descent as it moves negative. The Bollinger Bands® are also open to the downside. Keep an eye on this range, 1206 to 1258. Above it all may be well. Below it downside continues.

3rd party Ad. Not an offer or recommendation by Investing.com. See disclosure here or remove ads .

Disclosure: The information in this blog post represents my own opinions and does not contain a recommendation for any particular security or investment. I or my affiliates may hold positions or other interests in securities mentioned in the Blog, please see my Disclaimer page for my full disclaimer.

Original post

Latest comments

Risk Disclosure: Trading in financial instruments and/or cryptocurrencies involves high risks including the risk of losing some, or all, of your investment amount, and may not be suitable for all investors. Prices of cryptocurrencies are extremely volatile and may be affected by external factors such as financial, regulatory or political events. Trading on margin increases the financial risks.
Before deciding to trade in financial instrument or cryptocurrencies you should be fully informed of the risks and costs associated with trading the financial markets, carefully consider your investment objectives, level of experience, and risk appetite, and seek professional advice where needed.
Fusion Media would like to remind you that the data contained in this website is not necessarily real-time nor accurate. The data and prices on the website are not necessarily provided by any market or exchange, but may be provided by market makers, and so prices may not be accurate and may differ from the actual price at any given market, meaning prices are indicative and not appropriate for trading purposes. Fusion Media and any provider of the data contained in this website will not accept liability for any loss or damage as a result of your trading, or your reliance on the information contained within this website.
It is prohibited to use, store, reproduce, display, modify, transmit or distribute the data contained in this website without the explicit prior written permission of Fusion Media and/or the data provider. All intellectual property rights are reserved by the providers and/or the exchange providing the data contained in this website.
Fusion Media may be compensated by the advertisers that appear on the website, based on your interaction with the advertisements or advertisers.
© 2007-2024 - Fusion Media Limited. All Rights Reserved.