On September 19th, the Reserve Bank of Australia (RBA) released the minutes from its last meeting on monetary policy (September 5, 2017). Iron ore was perhaps the biggest headline coming out of those minutes. Surprisingly, the RBA called a top in the price of iron ore (emphasis mine):
“Iron ore prices had been supported at higher levels because of sustained strong demand for steel in China. However, prices were expected to fall in the period ahead because of the ongoing expansion of global iron ore supply following an extended period of strong investment. Members also noted that Chinese steel production per capita was likely to be close to its peak and that growth in Chinese steel production would not add much to global demand for iron ore in the future. Members observed that, in the longer run, there was potential for India to have a noticeable effect on commodity markets as investment in residential construction and transport infrastructure increased.”
The RBA is not specific about the duration of this topping action, but I have to assume it will be long enough to be significant. At a minimum, the assessment should mean that a recovery from the latest sell-off in iron ore should be faded.
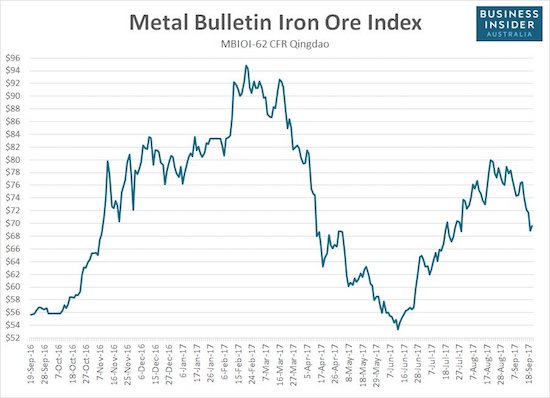
The price of iron ore has fallen sharply off its latest peak set in mid-August.
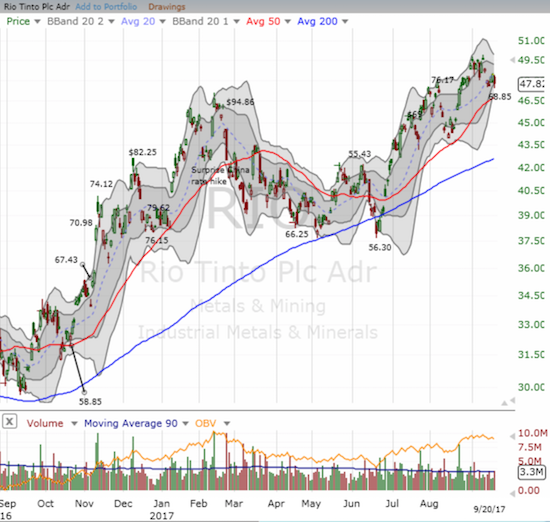
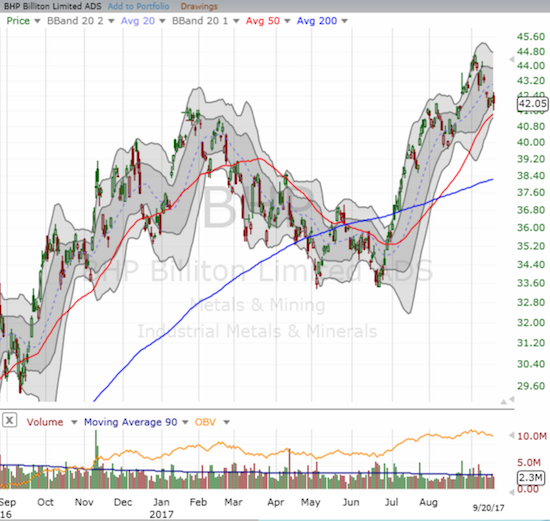
This news catches the two major miners of Australian iron ore at key technical levels. Both Rio Tinto (LON:RIO) and BHP Billiton (LON:BLT) (BHP) are hovering above uptrending support at their respective 50-day moving averages (DMAs).
Even with the current setback, Rio Tinto (RIO) is up about 26% from 2017’s bottom in June.
BHP Billiton (BHP) printed a more definitive double-bottom between May and June. The stock is up about 24% since then.
The numbers on the RIO chart indicate the approximate price of iron ore on that day. I use the notes as a reminder of the very loose correlation between iron ore stocks and the commodity. Yet, the major turning points are close enough for trading purposes. For example, the June bottoms in RIO and BHP roughly correspond to the bottom in June for the price of iron ore. This setup makes RIO and BHP good candidates for a pairs trade.
I like the current setup even better than past pairs trades. If the RBA is correct, iron ore is at risk of revisiting the lows from June. Also, at best, a fresh rally should only carry iron ore back to the high from August. Translating these bounds into short-term stock moves, the upside risk is around 5% and the downside opportunity is about 20%. The long side of the pairs trade is mainly a hedge in case the RBA’s expectations prove incorrect. I am more willing to bias to the downside given the iron ore inventories that have piled up. High inventories have been a story all year but did not prevent the relief rally over the summer. Current inventory levels were last seen over 5 years ago.
With the higher exposure to iron ore, RIO becomes the target for the short side of the pairs trade. BHP is a good candidate for the long side of the trade given it is a bit more diversified, and an activist investor is harassing the company to create more value for shareholders. Sizable dividends cushion both RIO and BHP: 4.6% and 4.1% respectively.
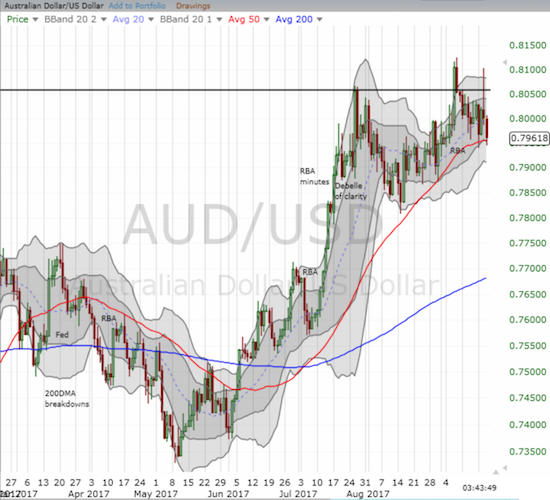
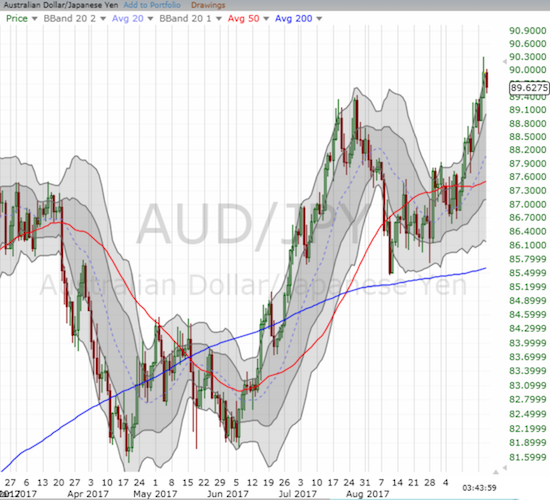
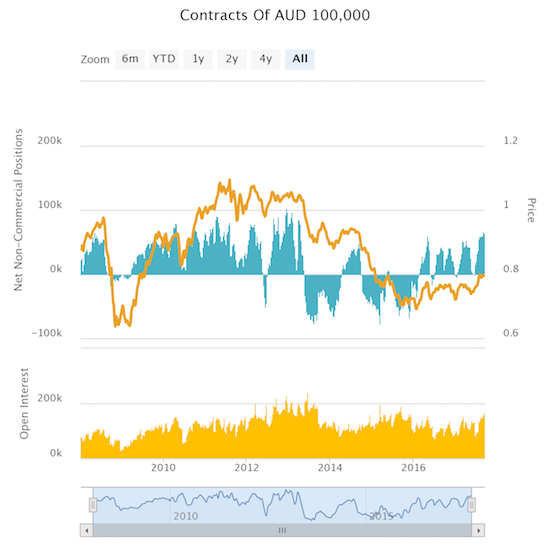
So what about the Australian dollar (FXA)? A peak in iron ore prices should eventually put pressure on the Australian dollar. Yet, AUD/USD surged to a new 28-month high earlier this month in the wake of the RBA’s last policy announcement. AUD/JPY has streaked higher nearly straight up since the end of August. Moreover, currency speculators are holding net long contracts at a level unseen since April, 2013.
The Australian dollar is having a tough time breaking through the 0.80 to 0.81 level for AUD/USD. The uptrending support at its 50DMA is still holding.
The Australian dollar soared to a near 2-year high against the Japanese yen. AUD/JPY has rallied nearly straight up for the month of September.
Speculators have exhibited five distinct waves of bullishness on the Australian dollar since the beginning of 2016. The latest surge is the biggest of the group.
Under the circumstances, I have an instinct to short the Australian dollar – especially since the RBA continues to try to dissuade the market from marking up the currency. However, Australia’s economic data are quite strong and should remain so for months to come and more. Perhaps at worst, the Australian dollar will embark on a wide trading range that frustrates both bulls and bears. If so, I will prefer to trade from the top of the range.
On a related note, the RBA pointed out that Australia’s adjustment to the boom and downturn in the mining industry is nearing an end. This means that a fresh sell-off in iron prices should not impact the economic strength of Australia enough to catalyze a marked sell-off in the Australian dollar.
“Employment growth had been broadly based across the states, suggesting that the adjustment to the end of the mining investment boom was nearing completion. Solid growth in employment was expected to continue, which would support household incomes and thus spending in the period ahead.”
Be careful out there!
Full disclosure: long and short positions on the Australian dollar

