A resurgent dollar post-Fridays not so bad data, weighs on oil and gold, even if only temporarily.
Friday’s better than expected NonFarm Payrolls, at 209,000 jobs added, wasn’t a bad number, but it wasn’t a king hit one other. The rally in the U.S dollar may well be just as much to do with short term positioning as it was with the data. We also note, that the hourly earnings were almost flat at 2.50% year on year and the participation rate remains anchored around 63.0%. Hardly earth shaking enough for the Federal Reserve to pull the inflation gun down of the wall and pull the trigger for a September hike.
Nonetheless, U.S. treasury yields moved higher and so did the dollar. It maintains my base case that it is the trajectory of U.S. rates that is the real story of 2017. In the short term though, there is no doubt that a stronger dollar is weighing on gold in particular and to a lesser extent oil even if it is only near term pain for bulls.
OPEC/Non-OPEC’s technical committee is meeting quietly today and tomorrow in Abu Dhabi, and headlines from this may see some volatility in oil prices with compliance top of their agenda as well as bringing Nigeria and Libya “into the fold.”Traders appear to be content to await the API and EIA Crude Inventory numbers, tomorrow and Wednesday evening Asia time, for a sense of direction in what is generally, a very data light week for financial markets.
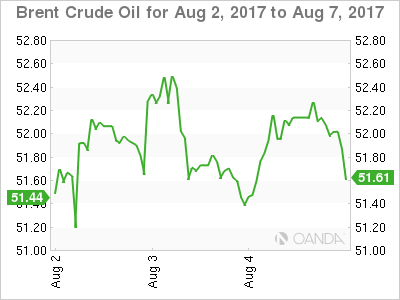
Brent spot opened unchanged at 52.15 with its triple top at 52.70 unchallenged thus far, and the must break level before we can talk about a new leg higher. Brent has drifted lower by around one percent in Asia, still some way away from the support that continues to be in the 50.45/65 zone. The zone contains its 50% Fibonacci retracement and the 100-day moving average.

WTI
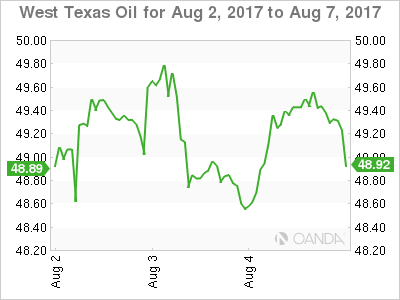
WTI spot opened unchanged at 49.40 in Asia and had drifted one percent lower to 48.80 over the session. With its double top resistance at 50.30 also unchallenged, support continues to be at 48.20, last week’s low, and the 100-day moving average at 47.80.

Gold
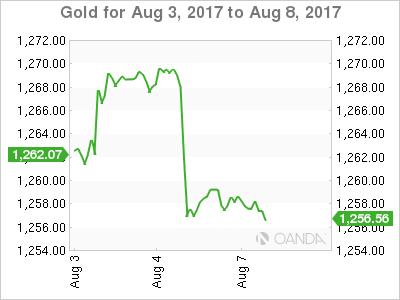
The strong NonFarm Payrolls data on Friday saw the U.S. dollar strengthen in general and this weighed on gold as the week drew to a close, falling 10 dollars to the 1258.50 area. Whether the dollar strength is temporary or more permanent has yet to be seen, and in a data light week unlikely to be answered anytime soon.
As a result, gold will be somewhat at the mercy of geopolitical headlines in the coming days and may also suffer if the recent dollar weakness continues to correct.
The price action on Friday left gold looking less than spectacular as we started the week’s trading in Asia unchanged at 1258.50. It has drifted two dollars lower across the session to 1256.20, hovering above two keys supports. The 100-day average at 1252.85 and it’s 50% Fibonacci retracement at 1249.25, the latter being a pivot level for price action of late.
Last week’s resistance levels at 1274.20 and 1282.10 are now somewhat distant and unlikely to be challenged in the first half of the week at least.

