RenRen Inc. ((RENN)), formerly Oak Pacific Interative, incorporated in February 2006, is a social networking Internet platform in China. RenRen generates revenues from online advertising and Internet value-added services (IVAS).
This is a vol note along with order flow. The news pushing the volume, vol and stock is quite simply, Facebook. Here's a news snippet with some interesting comps:
"According to multiple reports, the online social media giant Facebook is expected to file for its much-anticipated IPO next week, seeking a valuation of between $75-$100 billion. It has also been estimated that the company generated revenue somewhere in the range of $4.0-$4.5 billion in 2011. So, should Facebook start with a market cap of $87.5 billion -- the mid point of what is expected -- and if it generated revenue of $4.25 billion last year, this would give it a P/S of about 20.5x. Its sales in FY11 were said to more than double from 2010's $2.0 billion.
For the sake of comparison, LinkedIn (LNKD) had a P/S of over 38x when it went public back on May 19, 2011. Of course, LNKD has since pulled back, and is now trading with a trailing P/S of around 16x. RenRen (RENN), which is known as "China's Facebook", is now trading with a P/S of about 20x."
Source: Provided by Briefing.com (www.briefing.com)
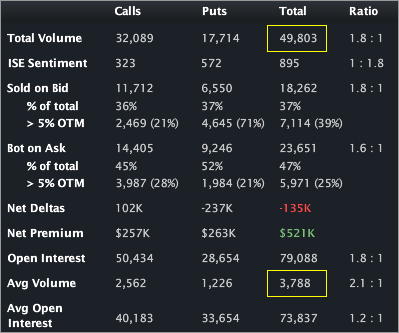
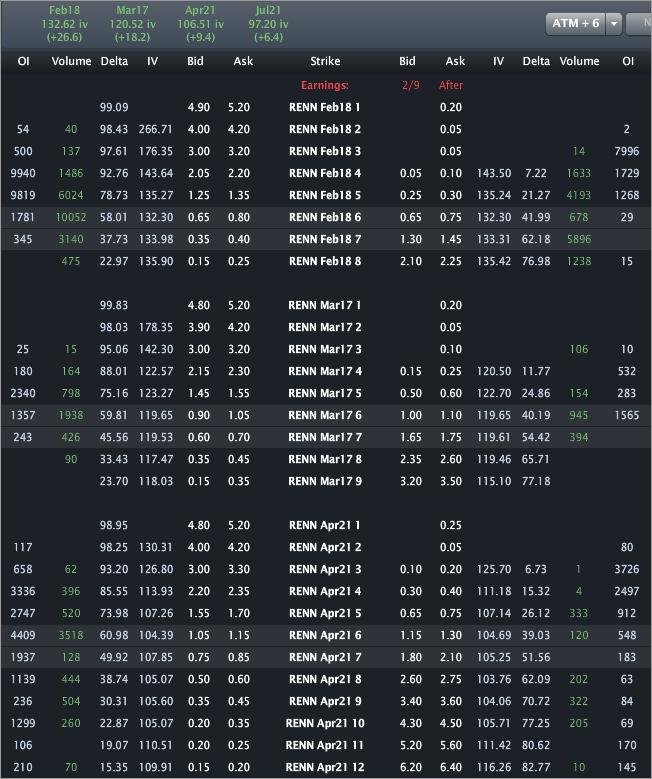
On the news RENN has traded just under 50,000 contracts on total daily average option volume of 3,788. Feb 6 calls have traded more than 10,000x while the Feb 7 put shave traded just under 6,000x. It seems like the pubic at large is buying premium in RENN -- betting on more huge movement in the near-term. The Stats Tab and Day's biggest trades snapshots are included (below).

The Options Tab (below) illustrates that the Feb 6 calls and Feb 7 puts are mostly opening (compare OI to trade size). The puts feel like purchases, the calls seem a bit more ambiguous given the trade prices.
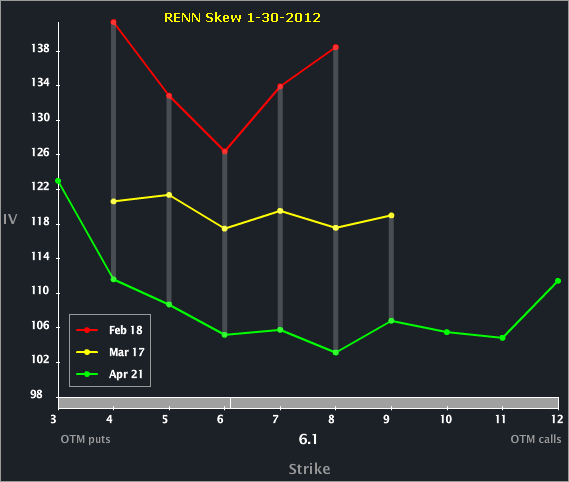
The Skew Tab snap (below) illustrates the vols by strike by month.
We can see a noticeable spread between each of the front three months with the front expos showing higher vol. We can also see the front month has a parabolic skew with the upside calls reacting to that order flow -- circumstantial evidence that the calls in Feb are purchases.
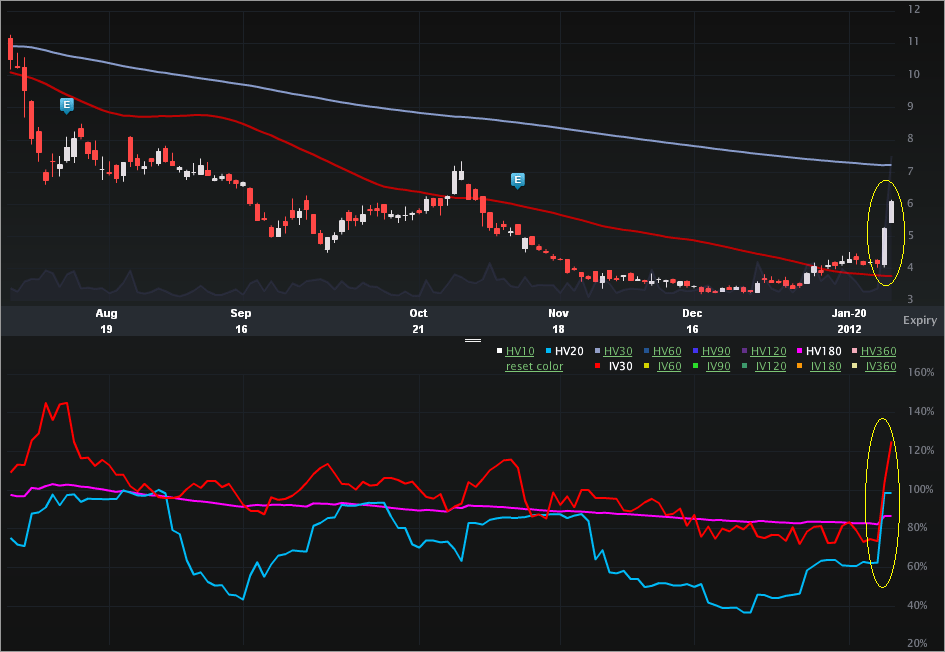
Finally, the Charts Tab (6 months) is below. The top portion is the stock price, the bottom is the vol (IV30™ - red vs HV20 - blue vs HV180 - pink).
Check out the stock pop over the last two days, up 46.3% as of this writing. On the vol side we can see the implied has popped to outpace the HV20™. IV30™ is up 71.3% (not percentage points) in those same two days.
All in all it's been some pretty fantastical movement (stock and vol) of late. If the IPO Facebook hype isn't enough, try "China's Facebook." Crazy.
This is trade analysis, not a recommendation.
- English (UK)
- English (India)
- English (Canada)
- English (Australia)
- English (South Africa)
- English (Philippines)
- English (Nigeria)
- Deutsch
- Español (España)
- Español (México)
- Français
- Italiano
- Nederlands
- Português (Portugal)
- Polski
- Português (Brasil)
- Русский
- Türkçe
- العربية
- Ελληνικά
- Svenska
- Suomi
- עברית
- 日本語
- 한국어
- 简体中文
- 繁體中文
- Bahasa Indonesia
- Bahasa Melayu
- ไทย
- Tiếng Việt
- हिंदी
RenRen, China's Facebook: Futures Benefitting From Facebook IPO Hype
Published 01/31/2012, 03:00 AM
Updated 07/09/2023, 06:31 AM
RenRen, China's Facebook: Futures Benefitting From Facebook IPO Hype
3rd party Ad. Not an offer or recommendation by Investing.com. See disclosure here or
remove ads
.
Latest comments
Install Our App
Risk Disclosure: Trading in financial instruments and/or cryptocurrencies involves high risks including the risk of losing some, or all, of your investment amount, and may not be suitable for all investors. Prices of cryptocurrencies are extremely volatile and may be affected by external factors such as financial, regulatory or political events. Trading on margin increases the financial risks.
Before deciding to trade in financial instrument or cryptocurrencies you should be fully informed of the risks and costs associated with trading the financial markets, carefully consider your investment objectives, level of experience, and risk appetite, and seek professional advice where needed.
Fusion Media would like to remind you that the data contained in this website is not necessarily real-time nor accurate. The data and prices on the website are not necessarily provided by any market or exchange, but may be provided by market makers, and so prices may not be accurate and may differ from the actual price at any given market, meaning prices are indicative and not appropriate for trading purposes. Fusion Media and any provider of the data contained in this website will not accept liability for any loss or damage as a result of your trading, or your reliance on the information contained within this website.
It is prohibited to use, store, reproduce, display, modify, transmit or distribute the data contained in this website without the explicit prior written permission of Fusion Media and/or the data provider. All intellectual property rights are reserved by the providers and/or the exchange providing the data contained in this website.
Fusion Media may be compensated by the advertisers that appear on the website, based on your interaction with the advertisements or advertisers.
© 2007-2024 - Fusion Media Limited. All Rights Reserved.
