Recessions occurring in a new president’s first year in office? Over the last 100 years, they have taken place three times as often as in other periods. In fact, the initial year of a president’s tenure has dovetailed with eight of the previous eleven economic contractions.
George W. Bush had to deal with the fallout from the dot-com bubble. Barack Obama had to address the financial crisis. And Clinton? Trump? Gary Johnson? The next president is exceptionally likely to face a significant downturn in the U.S. economy.
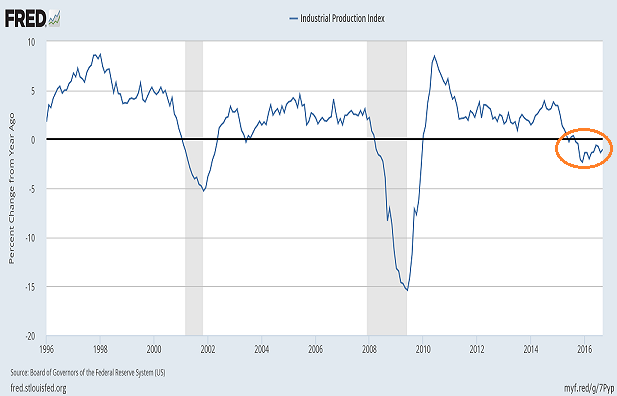
In some ways, the economic environment is already teetering. Consider industrial production. It measures the output of manufacturing, mining and utilities. The most recent year-over-year reading? -1.03%. This actually marked a thirteenth consecutive month for contraction in the industrial sector.
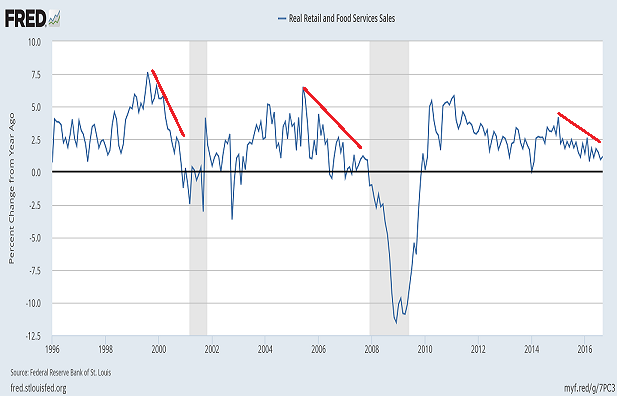
Manufacturers are not the only ones that are struggling. Retailers have been finding it more and more difficult to sell their wares. Indeed, current levels of year-over-year revenue generation are more consistent with stagnation than acceleration.
Optimists might choose to point to employment trends. Yet even job growth has shown definitive signs of fatigue. Job growth topped out back in February of 2015 at 2.3%. The most recent September employment report? 1.7%.
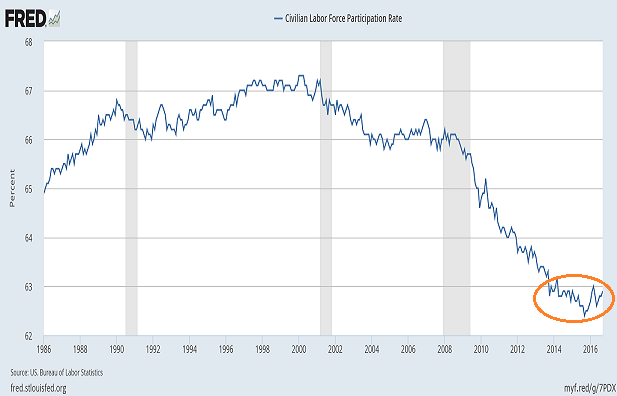
Meanwhile, growth in aggregate hours worked on a year-over-year basis has dipped from a 2015 pinnacle of 3.5% to roughly 1% today. Moreover, the 13.5 million new jobs since the end of the Great Recession have not been enough not compensate for the 18 million increase in working-aged individuals. Consequently, the labor force participation rate has stagnated below 63% for the last three years.
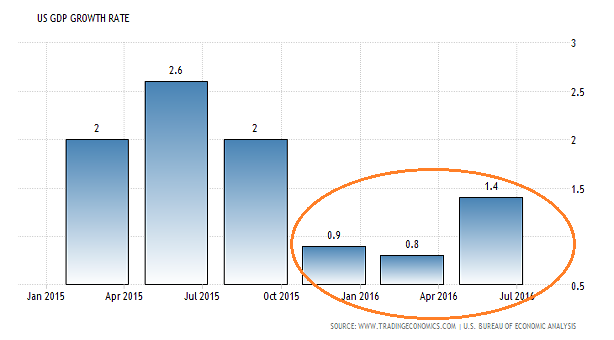
The overall economy is less vibrant than it was a year ago. The growth rate for gross domestic product (GDP) may not be negative. On the flip side, we have seen three consecutive quarters below the recovery average (2%). That hardly inspires confidence when the current economic expansion is already the slowest on record.
Granted, an economic recession in 2017 is not a foregone conclusion. Nevertheless, a weakening economic backdrop typically receives fiscal stimulus, monetary stimulus or both. The country may get neither. The Federal Reserve intends to hike overnight lending rates in December. And the next president? She/he would have an exceptionally difficult time convincing the House of Representatives in Congress to vote in favor of an even larger annual deficit.
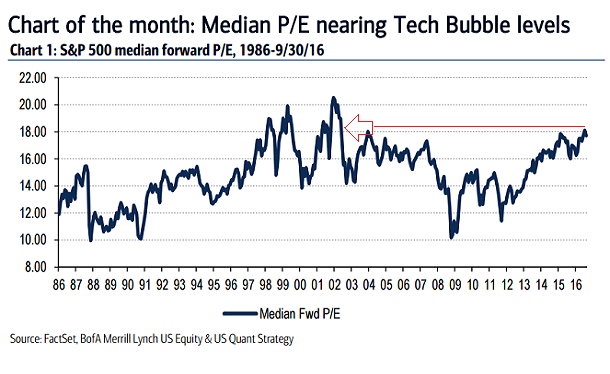
Where does this leave investors? It leaves them grappling with how committed they should be to overvalued equities.
If ultra-low interest rates justify higher valuations (a flawed assumption, though widely accepted), then what might one anticipate if borrowing costs remained static? Wouldn’t stocks hit a plateau if borrowing costs did not move any lower? And what if they actually moved up?
Keep in mind, the yield on the 10-year Treasury has moved from a record low of approximately 1.36% up to roughly 1.76%. Those 40 basis points in the 10-year represent a 30% jump; the spike also impacts corporate borrowing costs.
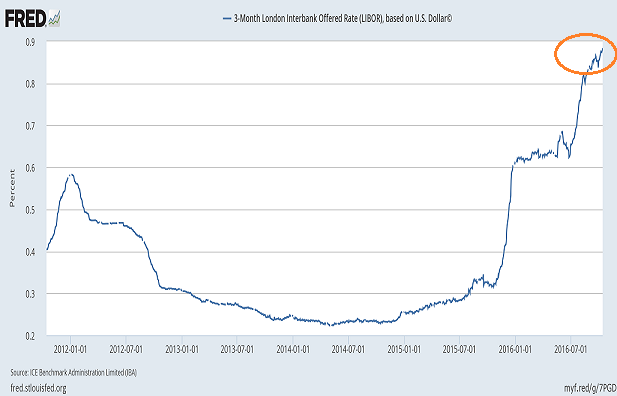
Even more troubling, trillions of dollars in loans are actually tied to the London Interbank Offered Rate (LIBOR), not the 10-year yield. LIBOR affects everything from floating rate mortgages to credit card rates to consumer loans to small business loans. And now, with 3-month LIBOR hovering at .9%, many may have witnessed the equivalent of a quarter point rate hike back in June.
Bottom line? The next president – Clinton, Trump or Johnson – may not be able to do much about economic enfeeblement. And stock valuations cannot climb into the stratosphere indefinitely. That means S&P 500 corporations are going to have to start raking in the profits per stock share… pronto!
It is certainly possible that things can turn around for company profitability as well as for the overall economy. On the other hand, tactical asset allocators may want to keep 25% in low-yielding money market accounts. For one thing, cash helps one weather market storms – storms that will last longer than the “Brexit” or the January (2016) washout. Currently, 40% of S&P 500 components are in downtrends.
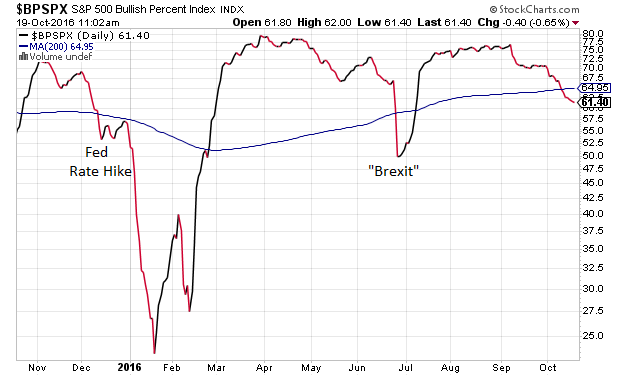
Low-yielding cash provides another benefit. Specifically, it serves up an opportunity for re-establishing positions in assets when valuations revert back to more attractive levels. From a historical standpoint, the premier time to step up one’s exposure to stocks is when valuations pull back from lofty heights and when the price movement of the market itself re-enters a bullish uptrend.
Disclosure: Gary Gordon, MS, CFP is the president of Pacific Park Financial, Inc., a Registered Investment Adviser with the SEC. Gary Gordon, Pacific Park Financial, Inc, and/or its clients June hold positions in the ETFs, mutual funds, and/or any investment asset mentioned above. The commentary does not constitute individualized investment advice. The opinions offered herein are not personalized recommendations to buy, sell or hold securities. At times, issuers of exchange-traded products compensate Pacific Park Financial, Inc. or its subsidiaries for advertising at the ETF Expert web site. ETF Expert content is created independently of any advertising relationships.
