
Earlier today we learned that the Third Estimate for Q1 2013 real GDP came in at 1.8 percent, down from 2.4 percent in the Second Estimate released last month. Let's now review the numbers on a per-capita basis.
For an alternate historical view of the economy, here is a chart of real GDP per-capita growth since 1960. For this analysis I've chained in today's dollar for the inflation adjustment. The per-capita calculation is based on quarterly aggregates of mid-month population estimates by the Bureau of Economic Analysis, which date from 1959 (hence my 1960 starting date for this chart, even though quarterly GDP has is available since 1947). The population data is available in the FRED series POPTHM. The logarithmic vertical axis ensures that the highlighted contractions have the same relative scale.
I've drawn an exponential regression through the data using the Excel GROWTH() function to give us a sense of the historical trend. The regression illustrates the fact that the trend since the Great Recession has a visibly lower slope than long-term trend. In fact, the current GDP per-capita is 11.9% below the regression trend.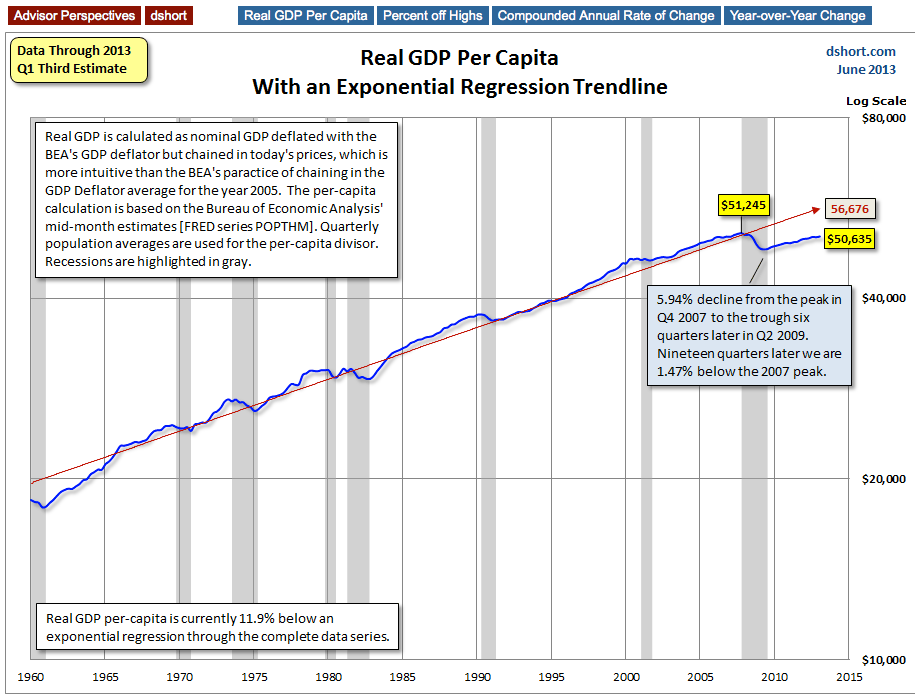
The real per-capita series gives us a better understanding of the depth and duration of GDP contractions. As we can see, since our 1960 starting point, the recession that began in December 2007 is associated with a deeper trough than previous contractions, which perhaps justifies its nickname as the Great Recession. In fact, at this point, 20 quarters beyond the 2007 GDP peak, real GDP per capita is still 1.19% off the all-time high following the deepest trough in the series.
Here is a more revealing snapshot of real GDP per capita, specifically illustrating the percent off the most recent peak across time, with recessions highlighted. The underlying calculation is to show peaks at 0% on the right axis. The callouts shows the percent off real GDP per-capita at significant troughs as well as the current reading for this metric.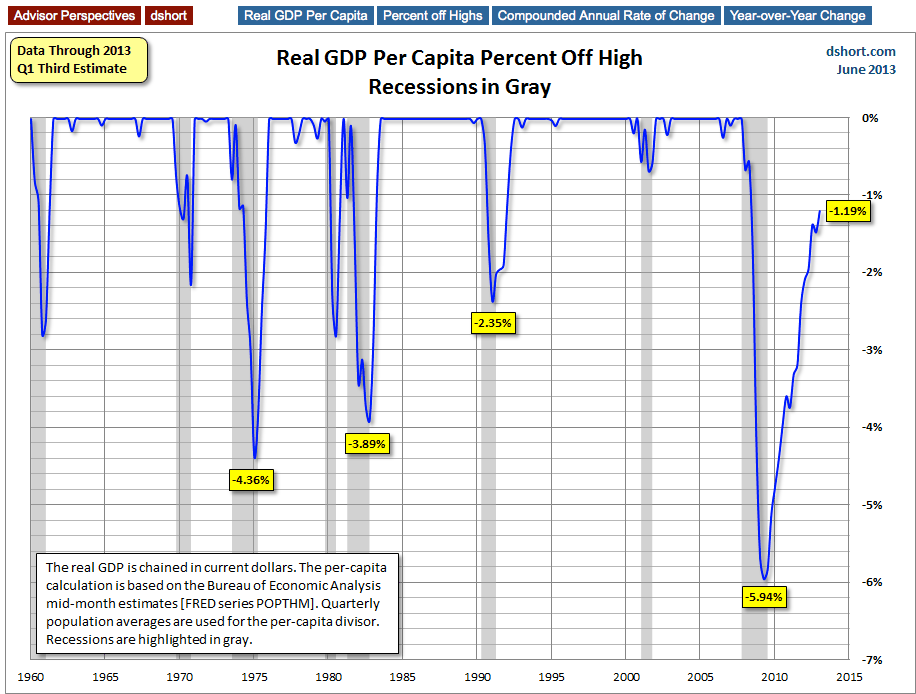
Quarterly GDP Compounded Annual Rate Of Change
The standard measure of GDP in the US is expressed as the compounded annual rate of change from one quarter to the next. The current real GDP as of the Q1 Third Estimate is 1.8 percent. But with a per-capita adjustment, the data series is quite different. The real per-capita GDP is currently at 1.1 percent (rounded from 1.12 percent). Both a 10-year moving average and the slope of a linear regression through the data show that the US economic growth has been slowing for decades.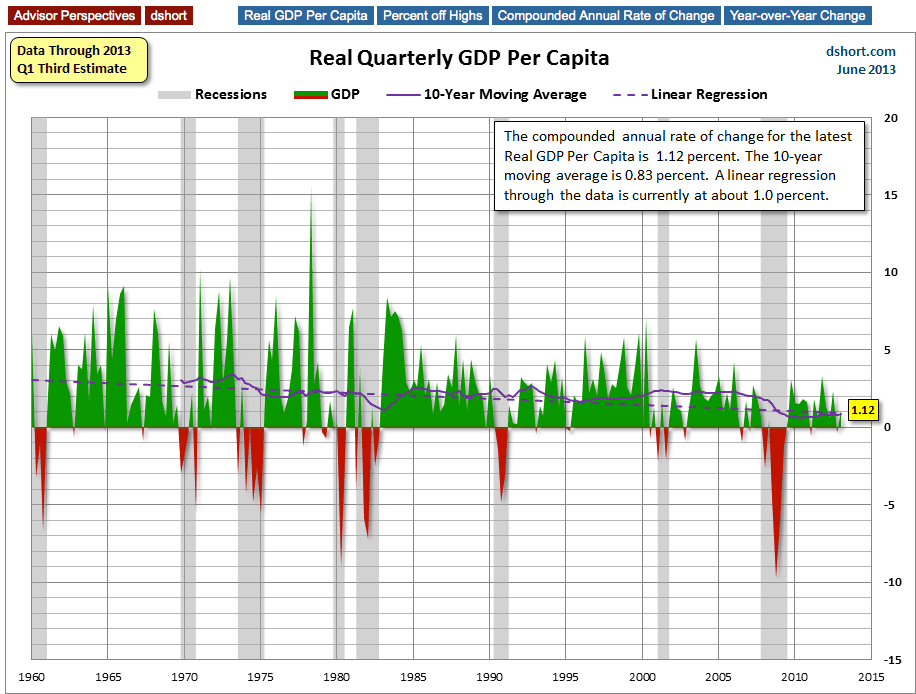
How do the two compare, GDP and GDP per capita? Here is an overlay of the two in the 21st century.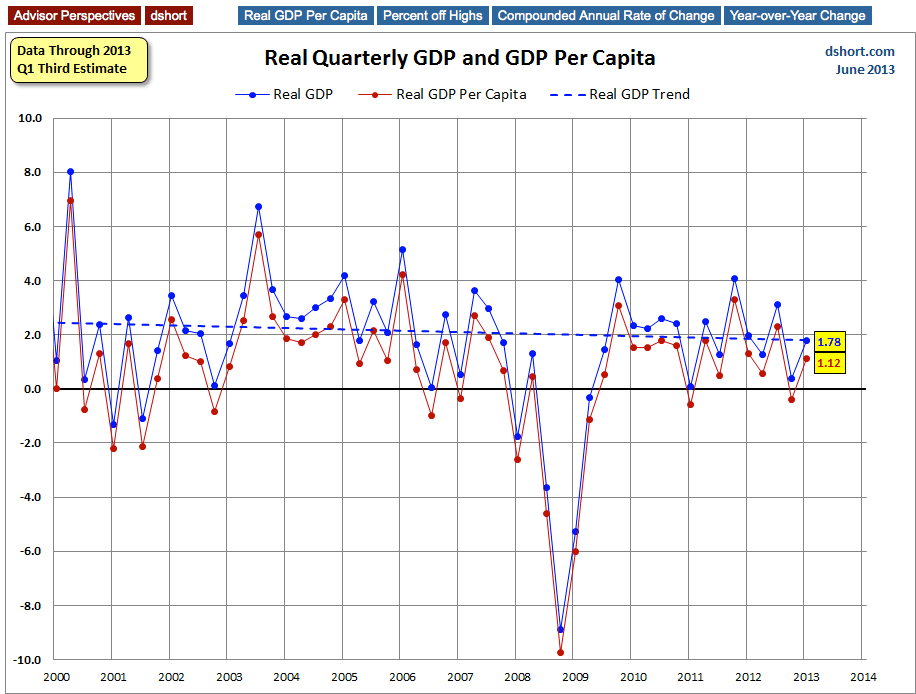
To expand on the illustration above: Since 1960 mean (average) GDP is 3.1 percent. Mean GDP per capita is 2.0 percent.
Year-Over-Year (YoY) GDP Percent Change and Recession Risk
Economists and financial journalists vary widely in their opinions about the present-day level of recession risk. The official call on recessions, of course, is the domain of the National Bureau of Economic Research, which makes the determination on recession start and end several months -- sometimes more than a year -- after the fact.
GDP per capita, as we've seen, is a weaker series than GDP. What does it suggest about our current recession risk? The next chart shows the YoY change in real GDP per capita since 1960. I've again highlighted recessions. The red dots show the YoY real GDP for the quarter before the recession began, and the dotted line gives us a sense of how the current level compares to recession starts since 1960. This chart suggests that, despite the obvious weakness in the economy, this indicator is not recessionary. That said, we must remember that GDP is a lagging indicator of the economy, and the annual GDP revisions in July will almost certainly change the latest data points.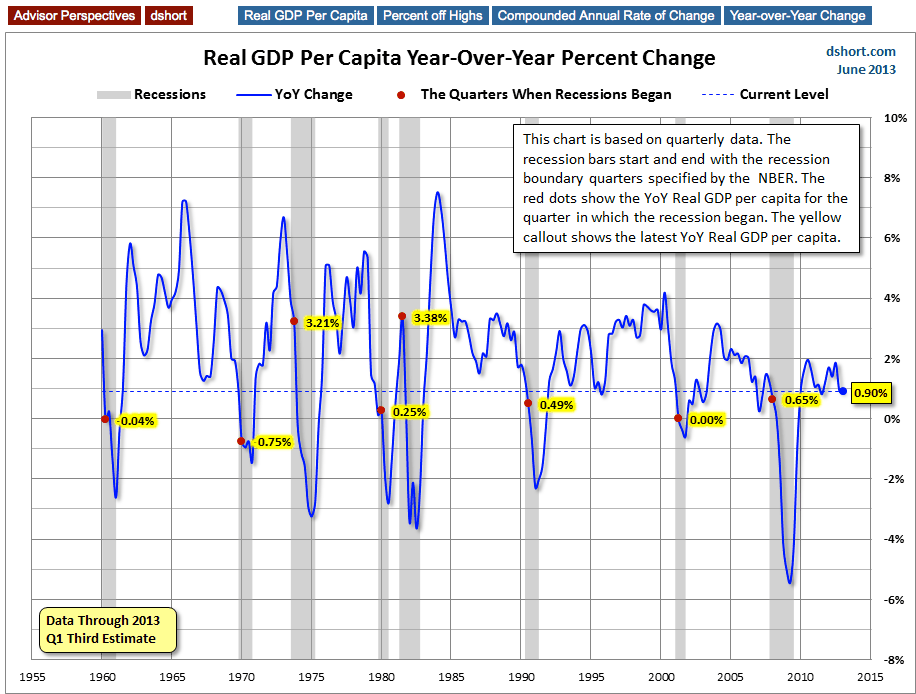
As the chart illustrates, the latest YoY real GDP per capita, at 0.90% is higher than the level at the onset of all the recessions in this series with two exceptions -- the recession triggered by the 1973 Oil Embargo and the second and more painful half of the early 1980's double dip. That second case was a outlier in that it was to some extent knowingly engineered by the Fed (then Chairman Paul Volcker), an inevitable side-effect of raising the Fed Funds Rate above 19 percent to break the back of the stagflation of the era. Here is a snapshot that illustrates the extreme Fed maneuver.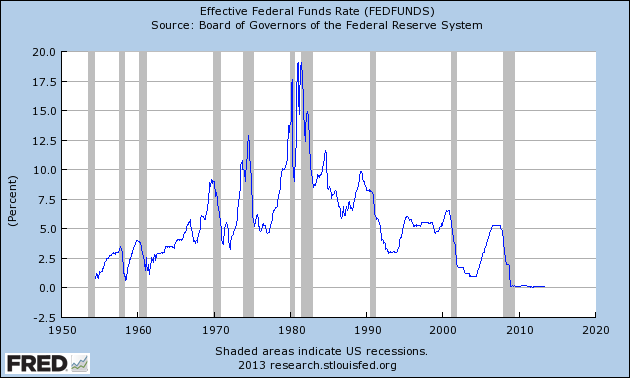
I'll update these charts next month when the Q2 2013 Advance Estimate of GDP is released.
- English (UK)
- English (India)
- English (Canada)
- English (Australia)
- English (South Africa)
- English (Philippines)
- English (Nigeria)
- Deutsch
- Español (España)
- Español (México)
- Français
- Italiano
- Nederlands
- Português (Portugal)
- Polski
- Português (Brasil)
- Русский
- Türkçe
- العربية
- Ελληνικά
- Svenska
- Suomi
- עברית
- 日本語
- 한국어
- 简体中文
- 繁體中文
- Bahasa Indonesia
- Bahasa Melayu
- ไทย
- Tiếng Việt
- हिंदी
Real GDP Per Capita: Another Economic Perspective
Published 06/26/2013, 11:49 AM
Updated 07/09/2023, 06:31 AM
Real GDP Per Capita: Another Economic Perspective
Latest comments
Loading next article…
Install Our App
Risk Disclosure: Trading in financial instruments and/or cryptocurrencies involves high risks including the risk of losing some, or all, of your investment amount, and may not be suitable for all investors. Prices of cryptocurrencies are extremely volatile and may be affected by external factors such as financial, regulatory or political events. Trading on margin increases the financial risks.
Before deciding to trade in financial instrument or cryptocurrencies you should be fully informed of the risks and costs associated with trading the financial markets, carefully consider your investment objectives, level of experience, and risk appetite, and seek professional advice where needed.
Fusion Media would like to remind you that the data contained in this website is not necessarily real-time nor accurate. The data and prices on the website are not necessarily provided by any market or exchange, but may be provided by market makers, and so prices may not be accurate and may differ from the actual price at any given market, meaning prices are indicative and not appropriate for trading purposes. Fusion Media and any provider of the data contained in this website will not accept liability for any loss or damage as a result of your trading, or your reliance on the information contained within this website.
It is prohibited to use, store, reproduce, display, modify, transmit or distribute the data contained in this website without the explicit prior written permission of Fusion Media and/or the data provider. All intellectual property rights are reserved by the providers and/or the exchange providing the data contained in this website.
Fusion Media may be compensated by the advertisers that appear on the website, based on your interaction with the advertisements or advertisers.
© 2007-2024 - Fusion Media Limited. All Rights Reserved.