· Riksbank to postpone repo path
· Unemployment at ?
· New Debt Office forecast
· Kommuninvest to open EUR benchmark programme
· SEK weaker on softer Riksbank
· Liquidity proxy sheds light on FX performance
Danske Bank’s market view in a nutshell
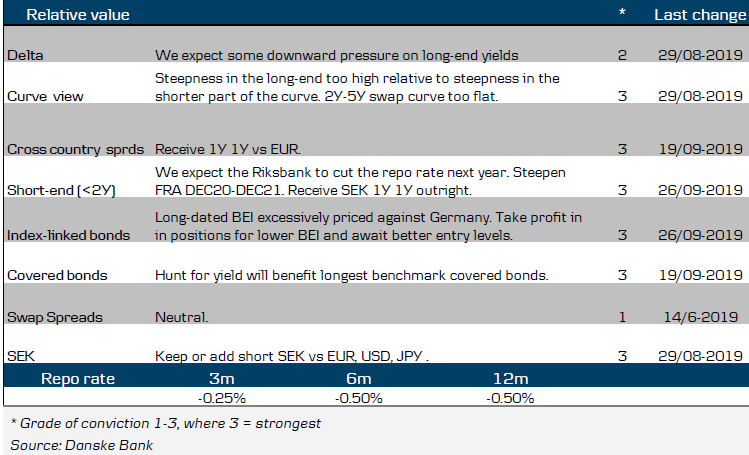
Riksbank to postpone repo path
Since the September Riksbank policy meeting, the markets’ view on the next policy step has been wobbling to say the least from at one point pricing in more than a 15bp rate cut to currently 7bp hikes (see table) so what has happened in the meantime?

Firstly, on the global stage there has been some tentatively positive news regarding a partial trade deal between the USA and China. No actual agreement has been signed yet but the higher tariffs that were planned to come into effect in October have been postponed. At least this could be seen as a sign that both sides are anxious not to escalate the dispute. But nonetheless, tariffs are still planned – much of the positives are just hopes for a deal. Secondly, on the Brexit front, the risk of the UK crashing out of the EU has abated with a last minute deal between Britain and the EU. What remains is that it will have to pass the British Parliament. Thirdly, the very weak PMI readings seen in Germany for some time finally got company from the US with ISM dipping below the 50 threshold and as did the Swedish PMIs (both manufacturing and services). Now, it seems pretty clear that global manufacturing industry actually is in recession. The question now is rather whether it will rebound soon or pull private services sectors with it down. Riksbank has perceived the global weakness mainly as a risk to its forecast, but now it should have become more a fact.
Since the September meeting, the full Q2 GDP data has been released, printing 1.0 % y/y versus the advanced estimate of 1.4% y/y going into the Riksbank’s forecast. Riksbank’s forecast for Q3 is 1.8 % y/y. In comparison our GDP tracker currently suggests a print of 1.4 % y/y, very close to our assumption in our most recent Nordic Outlook. Moreover, there is no doubt that the labour market is deteriorating even considering that the most recent LFS prints probably overstate the unemployment rate to some extent. Statistics Sweden says that the unemployment rate was probably understated earlier this year, the rise hence started earlier but has been slower than suggested by reported data (see more below). In our view that makes the deterioration in the labour market more credible, not looking like a ‘2008-2009 moment’ but rather like the impact one would expect in a more normal economic downturn. Of course, reported unemployment at 7.3% on average for Q3 is clearly higher than the 6.8 % in the Riksbank’s current forecasts, but as mentioned, it is hard to draw any conclusions from that.

At the same time there is no relief in terms of the inflation outlook. To be sure, September CPIF inflation did print 1.3% y/y, in line with the Riksbank’s forecast. In the next two months we do expect a slight increase in line with the Riksbank but CPIF will remain well below the 2% target. A more worrying development for the Riksbank may be, however, that inflation expectations, in particular money market expectations, are de-anchoring from the target on all horizons. Less so on 5y, but the shorter horizons have recent been close to 1.5%.
In the background, the Fed and ECB have been easing policies, the opposite of RB’s intentions. All in all, we expect the Riksbank to signal a delay of the intended next rate hike. We expect at least a verbal intervention stating the hike will come in February rather than December, most likely it will be accompanied by a shift in the repo rate path too.
Unemployment at ?
On paper, September unemployment did not correct at all but held steady at 7.4% (s.a). But – and this is an important but – SCB says that it has identified some calculation problems. In short, unemployment was underestimated earlier this year – in practice unemployment started to move higher during spring 2019, but the very steep rise in more recent months is overestimated. For employment it is the other way around. Revised data will be published within a month. So the big picture is – as far as we understand – intact, the labour market is cooling off but right now we simply do not know at what pace. For the same reason we do not know the true rate of unemployment at this stage. It is an irony that SCB on its home page states: We provide society with statistics that can be trusted.
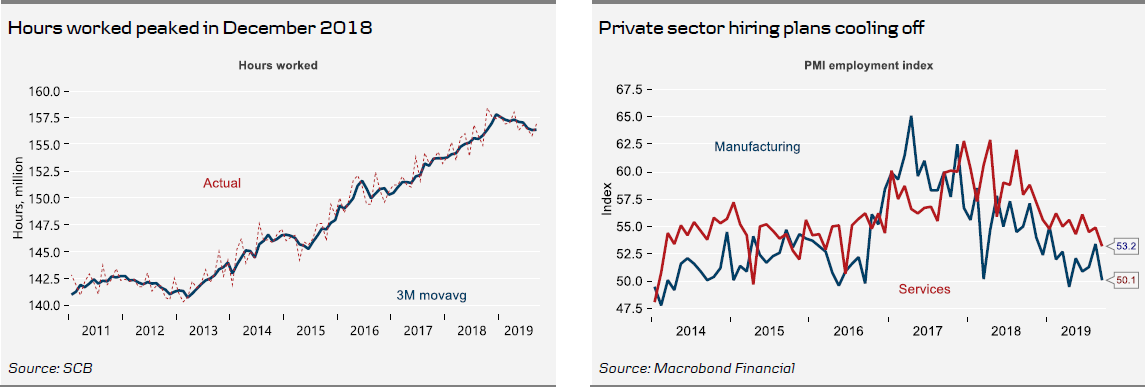
Statistics for hours worked do not appear to be to be affected to any significant degree according to SCB. Working hours peaked in December 2018 and have declined somewhat since then. At this stage, the survey based data showing a decline in hiring plans seems to be the only job-market data that can be relied upon for the time being.
New Debt Office forecast
In the July forecast the DO projected a SEK121bn budget surplus this year turning to a SEK19bn deficit in 2020. Notice that the large surplus this year to a large extent is an accounting effect due to the fact the RB earlier this year decided not to re-finance a maturing foreign currency loan.
The forecast was based on the assumption of a soft landing with GDP growing at 1.4% next year and a very modest rise in unemployment (see table below). Data since July suggest to us that revision risks are tilted to the downside for most variables. Of course the DO is also somewhat blinded by data problems at SCB but it appears probable that unemployment will be marked up and employment down. The latest forecast from the NIER might give an indication.
Monthly actual budget figures released after the forecast (June – September) show an accumulated surplus of SEK29.9bn, some SEK10bn below forecast. The below projection budget figures through September combined with lower macro assumptions are an indication that the budget projection for 2020 will be revised to a larger deficit. How much is of course a matter of guessing and (projected) deposits on tax accounts makes it even more uncertain. A guesstimate is that the 2020 budget forecast is lowered by SEK10-20bn.
Also, the DO will provide a first forecast for 2021. How they decide to distribute borrowing between different debt instruments also depends on how the DO sees state finances over the entire forecast horizon. Normally though, higher borrowing means a somewhat higher gross supply in nominal bonds.
Also look out for news regarding a green bond.

Events next week

Kommuninvest to open EUR benchmark programme
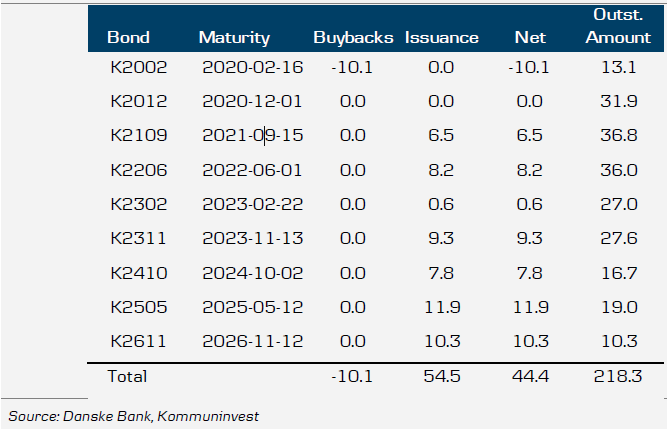
On 10 October, Kommuninvest announced its intention to include EUR benchmarks in its funding strategy (currently dominated by SEK and USD with some JPY). At the same time the borrowing forecast for 2019 was confirmed in the range of SEK120-140bn, with an expectation to end up at the higher end of the forecast. As issuance in EUR will come at the expense of other currencies, this decision should all else equal be positive for the SEK benchmarks long-term. Assessing the near-term impact on the SEK benchmark funding is a bit more difficult due to the lack of details, but some back-of-an-envelope calculations might give some input.
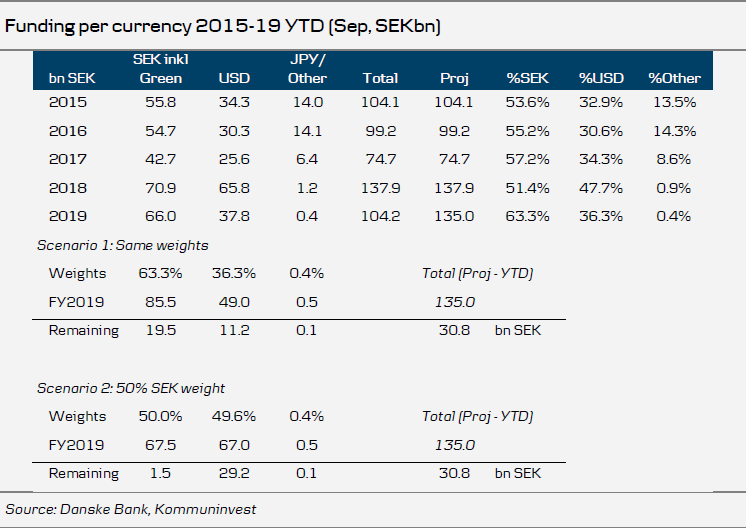
As of 30 September, Kommuninvest issued in total SEK104bn YTD, of which SEK66bn has been issued in SEK (including SEK11.5bn in green bonds). Assuming a year-end figure of SEK135bn, this gives a borrowing requirement of around SEK30bn left for Q4 in total. If we assume that the share of SEK issuance will be held constant, this requires issuance of SEK20bn. Compared to Q4 for previous years, this looks relatively high. If one instead assumes the share of SEK to be 50%, which is in line with previous years, the target for SEK is basically reached already. This, however, implies that the amount will instead be borrowed in a foreign currency, which will also make it look relatively high (assuming USD only). Hence, a combination of SEK and foreign currency is probably the most likely funding mix for the remainder of 2019.
As the announcement lacked details, we do not yet know if the ambition is to enter the EUR market during 2019, or if it will be in 2020. However, we would assume that preparing for an inaugural EUR transaction takes some time in preparation, so our base case is that it is more likely to happen in 2020 rather than 2019. Given the conventions of the EUR market, our best guess is that Kommuninvest may issue in EUR 1-2 times per year for a transaction size of about EUR500m to EUR1bn in the 5-7 year area. This would be similar to the strategy used by Swedish covered bond issuers.
Although the decision to enter the EUR market should be positive for SEK benchmarks ceteris paribus, it is hard to assess exactly how large the direct impact on SEK funding will be near-term. This is due to the fact that the impact on SEK funding will also, as described above, be a function of the USD volumes. Given the rather large difference in USD funding volume for 2018 (SEK65.8bn) compared other years (around SEK30bn), the near-term strategy on USD volumes can make a substantial difference. Hence, we remain a bit cautious on recommendations on the SEK benchmark curve until we have more details on the EUR funding strategy, and how it will impact the overall currency mix. If Kommuninvest were to announce an EUR transaction this year, however, we would view it as near-term bullish for the SEK benchmarks. Given the short-dated maturity of the loan portfolio to municipalities (about three years on average) and the long-end nature of the EUR market, we expect that entering the EUR market would reduce the borrowing requirements in especially the longest SEK benchmark loans.
YTD issuance in SEK benchmarks (SEKbn)
SEK weaker on softer Riksbank
As outlined in last week’s Reading the Markets – SEK: winter is coming, we foresee no imminent turnaround in the SEK’s trendwise decline but instead believe that EUR/SEK will breach 11.00 by year end on the basis of weak Swedish fundamentals and the Riksbank cutting rates back to -0.50 in February. Yesterday’s labour market statistics constitute the last key input before next week’s Riksbank meeting and taken at face value they entailed further headwinds for the Riksbank and hence also the SEK. However, as discussed above, and as reflected in how EUR/SEK traded immediately after the data release, there seem to be some measurement errors, of as yet unknown magnitude, to be taken into account. Even though Statistics Sweden points out that the last couple of prints are likely to have overestimated the actual unemployment, they also acknowledge that it probably was the other way around earlier in the year. Thus, instead of the substantial spike in unemployment that we have witnessed in the last couple of months, the ‘true’ profile might be less steep, but nevertheless indicative of increased unemployment. This would actually fit our macro view of Sweden better than the pattern we have seen in recent data, and as such constitutes no reason for us to change our narrative vis-á-vis the Riksbank and the SEK.
Thus, we still expect the Riksbank to formally address the weakening Swedish fundamentals and a postponement of the rate hike signalled for the turn of the year remains our base-case. However, we acknowledge that the somewhat uncertain state of the labour market may provide the Riksbank a respite at the October meeting, in where it keeps its forecasts intact in order to buy some time. If so, the SEK might well strengthen temporarily. However, this might prove short-lived as we believe the pressure will be right back on the Riksbank as inflation will continue to undershoot the target, growth will remain subdued and global uncertainties are set to linger.
On that last note, we saw the SEK strengthening yesterday on substantial ‘risk on’ following Brexit-related headlines. It may be too early to get overly excited about this, however, as Johnson still has to get the deal through the UK parliament. On top of this, other risk factors (trade war escalation etc.) still remain. Should sentiment turn sour once again, the SEK could be in for more trouble.
Current pricing indicates a 6bp hike in December, which is overly aggressive from our perspective (recall that pricing indicated a 16-17bp cut before the September meeting, since when Swedish data has continued to deteriorate). In other words, we see scope for a substantial repricing should the Riksbank start to quiver. If it instead sticks to its current plan of a turn-of-the-year-hike, it is reasonable to assume that some extra bps should be added to the pricing. Support-levels to keep an eye on are somewhere around 10.60 and 9.60, in EUR/SEK and USD/SEK respectively. With this being said, we think that risk/reward favours the downside (upside) in terms of RB-pricing (FX) and in 3M (NYSE:MMM) we see an imminent risk that EUR/SEK and USD/SEK are set to break through 11.00 and 10.00 respectively.
Liquidity proxy sheds light on FX performance
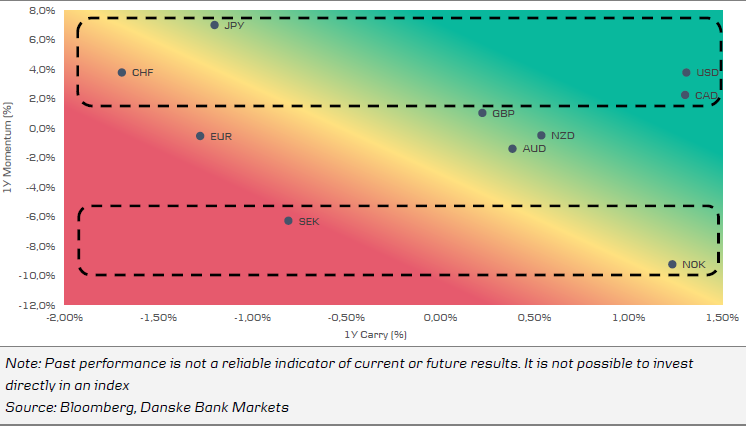
We have argued that the SEK depreciation rests on more than one leg, including cyclical factors (Riksbank, growth and more) as well as fundamental (current account, productivity and more) – see FX Strategy 11 October and FX Strategy 13 May. Carry has, as you know, been a strong theme where the USD is the big winner and the SEK appears to be a main loser. The chart below with carry against momentum illustrates this. The USD lies in the upper right corner together with the CAD which makes sense, whereas the SEK and the EUR lie in the lower left corner. However, carry, while important, is not the sole driver in FX. Neither the NOK nor the JPY fit into carry narrative. The NOK has performed as poorly as or even worse than the SEK despite offering almost as attractive carry as the USD nowadays. The JPY has performed as well or even better than the USD, despite Japanese rates being negative. Our guess is that at least part of the reason is liquidity. Investors tend to prefer relatively liquid currencies in a more uncertain market environment, the reason being that it could prove more costly to exit long positions in a relatively illiquid currency when everybody runs for the exit at the same time.
FX: carry explains a lot but not everything – is liquidity the missing link?
How to measure liquidity in currency markets? One approach is transaction data as reported in the BIS Triennal Central Bank survey. Here we learn that USD is extremely dominant, being a part of 88% of all transactions (always two legs). EUR (32%) is second, JPY (17%) is third and GBP (13%) comes in fourth. Then we have AUD (7%), CAD (5%) and CHF (5%). SEK (2.0%) and NOK (1.8%) are ranked 11th and 13th with a much lower transaction than G10 peers but at the same time much higher than most EM currencies.
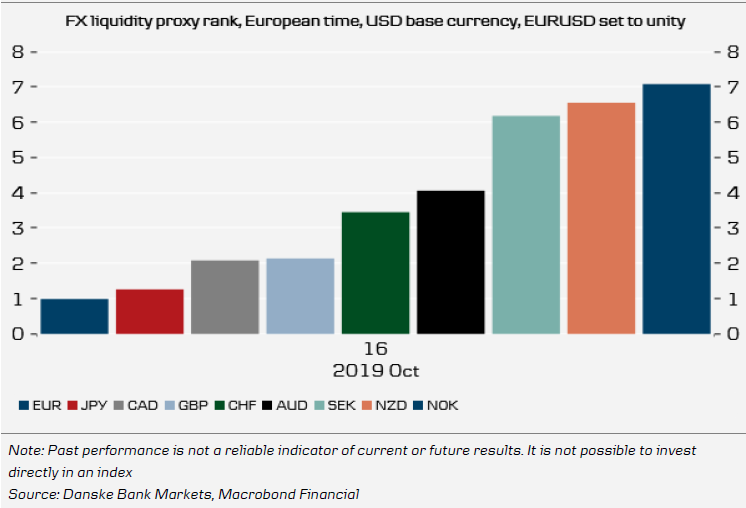
Here we have opted for another approach, namely the buy/sell spread measured in pips for different FX crosses with the USD as base. A tight spread indicates higher liquidity and a less tight spread is a proxy for a less liquid currency. What it measures more precisely is the cost of making a ‘faulty trade’, that is first buying a currency to the buy price and then immediately selling the same currency to the sell price with the buy/sell spread taken into account. We have used a normal spread (normal markets) with a normal amount (USD20mn) under European time zone (c.12:00 CEST). The rank for G10 is displayed in the chart below. The most liquid currency pair is, no surprise, EUR/USD. Not far behind comes USD/JPY. Then there is a small jump to USD/CAD and GBP/USD. Liquidity in SEK, NZD and NOK is six to seven times worse than for EUR/USD. The interpretation is not that NOK and SEK are illiquid currencies, but rather that they are much less liquid on a relative basis. In this way we are able to better understand why JPY is in the upper left corner and NOK in the lower right corner in the carry/momentum chart above.
Liquidity proxy, rank from most to less liquid currency cross
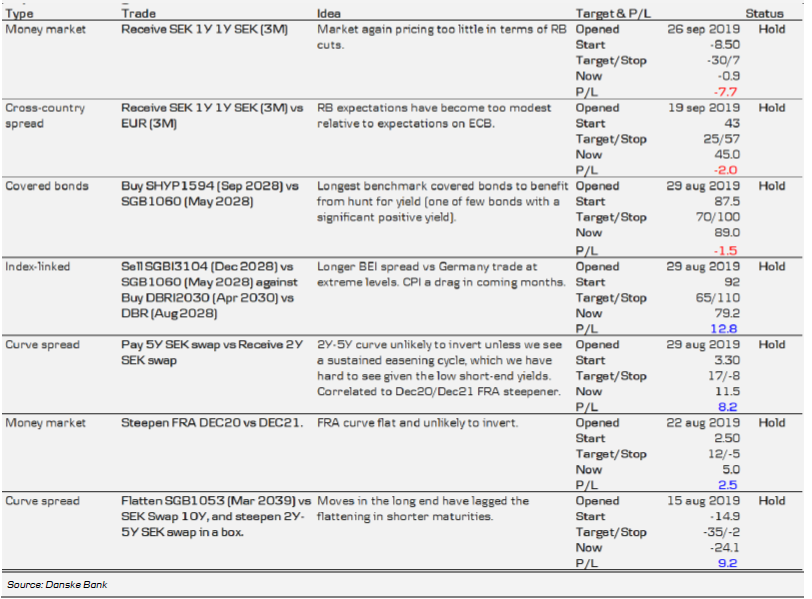
Open strategies
