Am I out of my investing mind? Any investor with half a brain will tell you to cut your losses short and let your profits run. Using a stop-loss is on par with such advice as buy low and sell high. Investment websites such as Investopedia and The Street recommend using this risk management tool. How could anyone rationalize the advice to let your losses run by not using stop-losses?
The Theory of the Stop-Loss
I remember my first read through the William J. O’Neil book, How to Make Money in Stocks… I thought that I had found the winning combination of fundamental and technical trading rules to find the next Microsoft in its infancy. Reality is a swift kick in the pants with steel-toed boots as I would later find out.
The stop-loss trading rule in the CAN SLIM book seemed like common sense – cut your losses if share prices fell 7 or 8% below your buy-in price. Becuase the upsides were so great when a trade did go well it appeared that I could earn 200 – 300% while only experiencing a maximum loss of 8%. Whether this is how the author meant for the information to come across of not, I do not know, but this was the take-home message for me.
Stop-Loss and Excess-Loss
After using stop-losses in conjunction with my investing, I quickly became frustrated. It seemed that as soon as my stop-loss order kicked in and liquidated my shares, prices rebounded. In fact, my stop-losses were often contrarian indicators to buy. Maybe I was just doing this all wrong.
I began to realize the truth when I started using strategy back-testing software which allowed me to statistically test this "risk management tool" in simulated trading across thousands of stocks and tens of thousands of transactions. I will share a sample of my findings with you below.
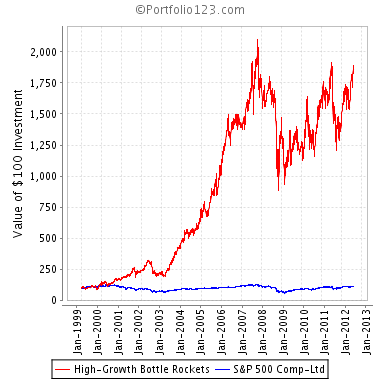
Here we have a high-growth volatile trading system that has made a decent amount of profit over the last 12 years. Even after accounting for transaction costs, this system was able to turn $100 of investment capital into almost $2,000. In this simulation every trade costs $5 and we factor in 0.2% slippage (when share prices get pushed while you are making the trade). You cannot see some of the other numbers but we have a small $5,000 inital amount to trade with.
This system traded well during the 2003 to 2008 bull market. You might be looking at the above chart and say, if only we could reduce the volatility and loss since 2008 we might be able to double our gains again since 2008. But is that really the case? The simple use of a stop-loss should enable us to minimize our losses to 8% while keeping the substantial upside…right? Look below for your answer… 
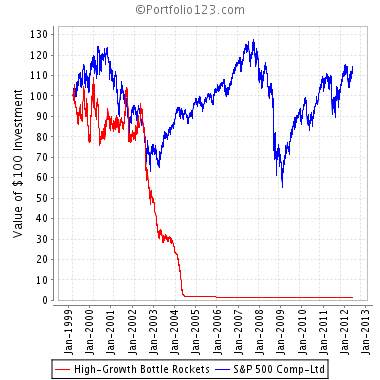
The stop-loss rule destroyed our portfolio! We are only left with $1.43 out of every $100 invested. How did this risk-reduction tool murder our gains?
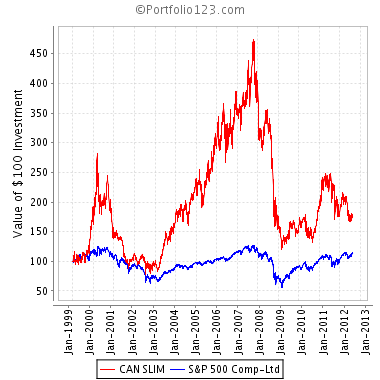
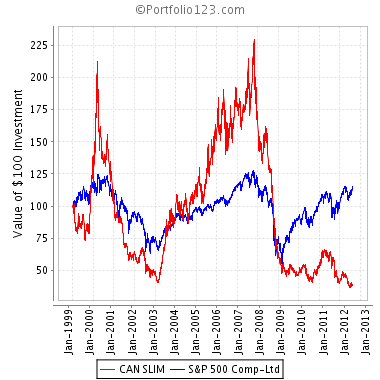
To be fair we will simulate it one more time (although I have done this endless times) with an adaptation of the William O’Neil CAN SLIM system. There will be two charts – the first is without a stop-loss and the second is with an 8% stop-loss below purchase price. Each trade costs $5 and slippage on this system is 0.3% with no OTC stocks allowed.

By adding a stop-loss we experience a drawdown of 84.2% from peak to trough and lose 62% of our original investment in the 12 year period. If stop-losses were not used we would have a max drawdown of 74% and have a 73% profit over 12 years for a 4% compound annual growth rate.
Academic Professionals Weigh In
Am I somehow rigging the numbers? Will stop-losses really erode gains? If so, how? To sum up what academics studying stop-losses found, I will cite from the paper, Re-Examining the Hidden Costs of the Stop-Loss:
We found that the perceived benefits of the stop-loss were largely balanced out by the hidden costs. As a result there is no inherent edge to be found in stop-losses or profit-taking stops. Furthermore, there is no clear optimal location to place a stop.
Reasons Why a Stop-Loss Can Harm You
Why could this purported risk management tool harm your portfolio returns? Of course, much depends on the specific stocks you are trading but here are some considerations to mull over:
- Stop-losses do not take into account fundamental value
Imagine you owned a utility stock with defensive earnings that can comfortably pay a certain dividend in almost any market condition. The current yield lies around 4%. Then unexpectedly a bear market hits and share prices dive 50%. Should you sell all your stock and buy back later during the bull market? Quite the opposite. Once you look at the fundamental value of the company you realize that now you can buy and essentially lock-in at 8% yields. In this slow moving economy you should absolutely load up on this lower-risk asset generating such a strong return.
The stop-loss only considers technical price action but you should be looking at the underlying fundamentals when trying to determine if you have a boat anchor or an even better deal on your hands.
- Stop-losses leave you open to manipulators
Have you ever seen share prices go up or down for seemingly no reason? Often it can be attributed to a major fund or institution buying or unloading a position quickly. But it might also be a hedge fund short-selling to create weakness in order to accumulate shares. As an example, a firm wants to buy a certain stock at $9.50 despite it trading at $10. So they short-sell the stock which temporarily drives prices down. This price drop kicks in many stop-loss orders and further downward pressure is experienced. At this point the firm switches to buying the high volume of shares that just came available. At the end of the day they have a net positive position at a much lower average price than $10.
- High transaction costs
Down markets are more volatile than up markets. If you sell during a panic drop, you will likely get your order filled at bad price. In extreme examples, think flash crash. In addition to slippage costs you need to consider the trading cost charged by your brokerage. This can quickly erode capital making an otherwise profitable strategy null. These costs are hard to avoid as the lower volume you trade the more expensive the brokerage fees become (relative to your investment capital) and the higher volume you trade the more slippage you are bound to experience.
Stop-Loss Take Home Message
In today’s volatile market where computer algorithms make up the majority of the trading volume, using stop-losses as a means of limiting risk can be useless or downright risky. It is much more advantageous to consider the value of underlying fundamentals in relation to share price instead of placing an arbitrary sell point based on share price alone. With good stocks you should be buying the dips and not the other way around.
While a stop-loss order below your purchase price seems like common sense, here at Portfolio Cafe we are in the business of making uncommon profits in hedge fund like products for individual investors.
