
Since 2008, I have seen various analysts criticizing the Fed, ECB and other central banks for their efforts at quantitative easing and other forms of unconventional monetary policy. These policies have been criticized as less than effective. One such analyst is Stephen Roach, formerly of Morgan Stanley:
While the Fed’s first round of quantitative easing helped to end the financial-market turmoil that occurred in the depths of the recent crisis, two subsequent rounds – including the current, open-ended QE3 – have done little to alleviate the lingering pressure on over-extended American consumers. Indeed, household-sector debt is still in excess of 110% of disposable personal income and the personal saving rate remains below 3%, averages that compare unfavorably with the 75% and 7.9% norms that prevailed, respectively, in the final three decades of the twentieth century.
With the Fed now hinting that it is thinking of taking its foot off the accelerator, we are now seeing the reversal of some of the effects of QE - and it's sent the markets into convulsions. The intention of all these unconventional policies was to bring down interest rates and push the market into taking more risk. As a result, asset prices have soared and risk premiums have shrunk. Just look at this chart from Zero Hedge: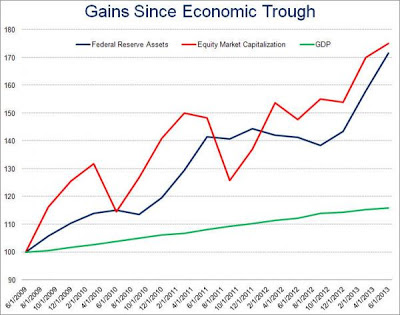
Now that the Fed is hinting that it is thinking about unwinding these programs, which Fed officials have been quick to distinguish between taking the foot off the gas (tapering) and stepping on the brakes (tightening), risk premiums have begun to rise and asset prices have fallen. This chart from Gwyn Davies shows that, despite Fed officials' communications policy, the market has been de facto tightened in spite of Federal Reserve actions: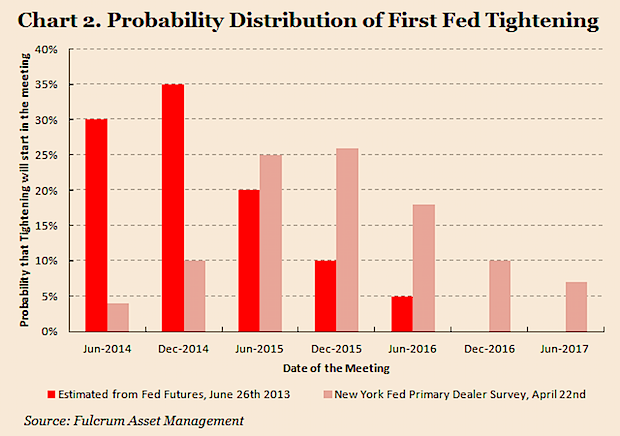
Consider the effects of this reversal:
- Treasury bond yields have spiked. The Fed began with lowering short-term rates, progressed to buying Treasuries further out on the yield curve and finally added agencies to its purchases. Now that the Fed has signaled that it is considering winding down its QE program, Treasury yields have spiked.
- It has caused carnage in the Eurodollar market. If you hold down short rates and then tell the world that you expect to hold short rates at zero or near zero for a long, long time, it is an invitation to Mr. Market to put on a carry trade - and it did, with leverage. The signal of reversal is causing these carry trades to unwind, the most obvious of which is the "get cheap funding and buy Eurodollar deposits" trade. See Vince Foster's Minyanville article Bernanke's Misfired Shot Heard 'Round the World.
- Other carry trades like the currency carry trade are being unwound in a disorderly manner.
- The Fed's implicit encouragement for the market to take risk pushed funds into junk and emerging market bonds. We have seen how investors reached for yield in the last few years, some of that money made its way into lower quality credits like junk bonds and emerging market bonds. In particular, the emerging market bond market has sold off in a frenzy. In addition, it has caused stress in a number of EM currencies as the market has begun to re-calibrate risk premiums.
- The market's reach for yield likely played a role in China's latest shadow banking bubble and recent liquidity squeeze. Michael Pettis explained the carry trade this way:
In May, however, the authorities began clamping down on the fake trade invoices, causing export revenues to decline. Foreign currency inflows into China dried up, as did the liquidity that had accommodated rapid credit growth. The combination of rapidly rising credit and slower growth in the money supply created enormous liquidity strains within the banking system. This is probably what caused last week's liquidity crunch and this week's market convulsions.
When Pettis wrote that Chinese companies imported foreign money and engaged in the practice of "profitably relending it as Chinese yuan", he is referring to injections into China's shadow banking system, which is really their subprime market. In a separate note, Izabella Kamanska of FT Alphaville also documented analysis from Deutsche's Bilal Hafeez indicating that the tight USD-CNY relationship was ripe for a carry trade.
- Tapering talk has devastated the TIPS market. As the market has contemplated the reversal of QE, inflationary expectations have plummeted and so have the price of TIPS.
- QE first buoyed commodity prices and now we are seeing the reversal of that trade. Gold and other hard commodities benefited from low and negative real interest rates. Now that we are seeing real interest rates rise (and inflationary expectations fall), commodity prices are getting hammered.
- Tapering talk has also implicitly hurt Europe. The ECB has been able to stabilize the eurozone with Draghi's "whatever it takes" remark and the unveiling of its OMT program, which has not been activated yet. Yield spreads of peripheral countries' bonds against Bunds have narrowed because of the ECB's threat of action, along with the flood of global liquidity. Now that the flood of global liquidity is starting to recede, the ECB may actually have to resort to OMT, which would cause another round of euro-angst and more risk premium re-calibration.
I've probably forgotten or missed out on some other side effects of the various rounds of Fed QE, but you get the idea. Many of these bets were leveraged bets as they were designed to help banks profit and repair their balance sheets, e.g. the Eurodollar carry trade. When these trades unwind, the effects will not be a blip, but a tsunami.
All these macro effects are suggesting that we are at the start of a risk re-pricing process that will take months to complete. It will not be friendly to asset prices at all.
Earnings headwinds
In the US, stock prices are starting to face headwinds from a deteriorating earnings outlook. Ed Yardeni documented that while Street earnings estimates continue to rise, forward sales estimates are falling. How long can this divergence continue? Can margins continue to rise?
One way of boosting earnings per share while the sales outlook is punk is to buy back shares. If you reduce the denominator (shares outstanding), earnings can rise (everything else being equal). Bloomberg reported that the level of share buybacks are so high that corporate quality is deteriorating [emphasis added]:
“The trend of improving credit quality has slowed as profits are slowing,” Ben Garber, an economist at Moody’s Analytics in New York, said in a telephone interview. “As the recovery matures, companies are liable to get more aggressive in taking on share buybacks and dividends.”
Rather than using cash to pay down debt, companies in the S+P 500 Index are attempting to boost their share prices by buying back almost $700 billion of stock this year, approaching the 2007 record of $731 billion, said Rob Leiphart, an analyst at equity researcher Birinyi Associates in Westport, Connecticut.
Borrowers controlled by buyout firms are on pace to raise more than $72.7 billion this year through dividends financed by bank loans, surpassing last year’s record of $48.8 billion, according to S+P Capital IQ Leveraged Commentary & Data.
After cutting expenses as much as they could to improve profitability, companies “will need to see further revenue growth to boost earnings from here,” Anthony Valeri, a market strategist in San Diego with LPL Financial Corp., which oversees $350 billion, said in a telephone interview.
The good news: Ursa Minor
All these factors add up to bad news for the stock market. The good news is that any pullback is likely to be relatively minor and the possibility of a market crash is remote. The Fed has made it clear that it continues to be "data sensitive" and will adjust policy as necessary.
Translation: The Bernanke Put still lives.
Relief rally: Mind the gap(s)
My inner investor has already pulled back to a position of defensiveness. My inner trader, on the other hand, is watching the relief rally for an entry point on the short side. I am indebted to Tim Knight for his idea of watching the charts of the iShares iBoxx USD High Yield Corporate Bond ETF (HYG), the SPDR Barclays High Yield Bond ETF (JNK) and the iShares S&P National AMT-Free Muni Bond Index (MUB) to watch for rallies up to fill the downside gaps. The theory is that stocks often see trading gaps filled after a price reversal, just as we are seeing now. After that, the down trend would continue. Tim Knight put it more colorfully than I ever could:
There are three ETFs I am watching very closely for gap closes. My motivation is twofold: first, I want to short the everloving bejesus out of them once the gaps are filled, and second, it’s going to be my signal to go balls-out shorting the equities in general.
As I write these words, the gaps in HYG, JNK and MUB have been filled. However, my inner trader is not ready to short "the everloving bejesus" out of this market yet. He is more inclined to pivot from a pure US-centric view to a more global macro view of the world and he is watching how the gaps in the ETFs of some of the aforementioned sectors that were affected by the Fed's QE actions are resolving themselves.
Consider the iShares Barclasy 20+ year Treasury Bond Fund (TLT), popularly referred to as the long Treasury ETF, which has not rallied sufficiently to fill the (tinted) gap: 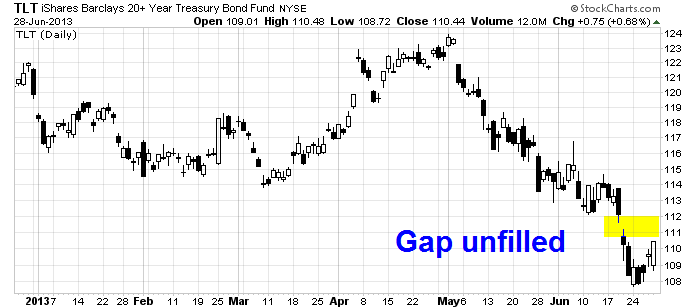
The PowerShares DB G10 Currency Harvest Fund (DBV), which is the ETF representing the currency carry trade, has seen its gap filled.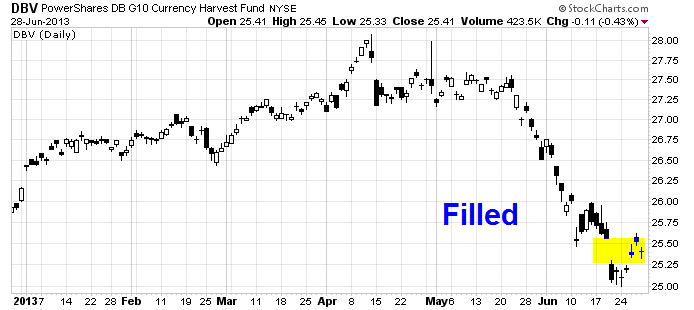
The emerging market ETFs have had their gaps either filled or mostly filled. Here is the chart for EM bonds the iShares JPMorgan USD Emerging Markets Bond Fund (EMB):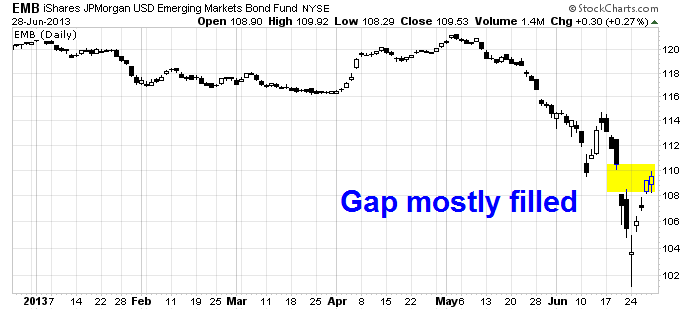
Here is EM equities via the iShares MSCI Emerging Markets ETF (EEM):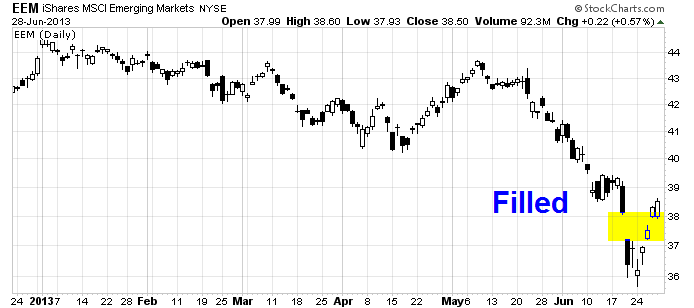
Here is China, the iShares FTSE China 25 Index Fund (FXI), which has been a focus of the markets in the past couple of weeks: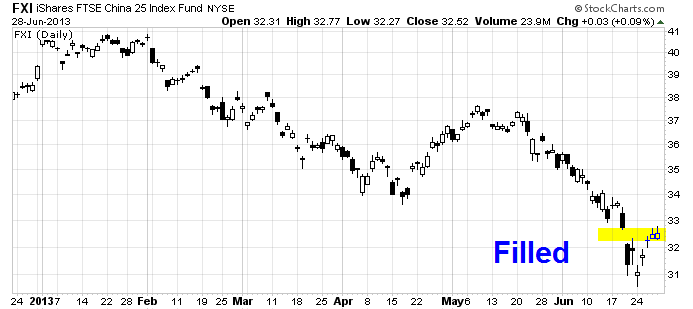
Commodity ETFs, however, aren't performing that well and they continue to be in a downtrend without rallying to fill their gaps. Here is the PowerShares DB Commodities Tracking Index Fund (DBC), as a representative of the entire commodity complex. DBC violated a key support level and continues to weaken. It has seen no rally attempt to fill in its gap.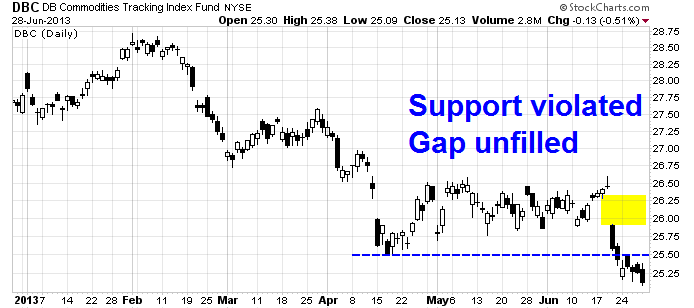
Gold, via the SPDR Gold Trust ETF (GLD) is one of the ugliest charts of all. Note, however, how it rallied back in April and May to fill in the gap (shown in green) but it continues to weaken and has shown two gaps (in yellow) that have yet to be filled in a relief rally.
The currencies of commodity-linked economies are behaving badly. Here is the Aussie dollar: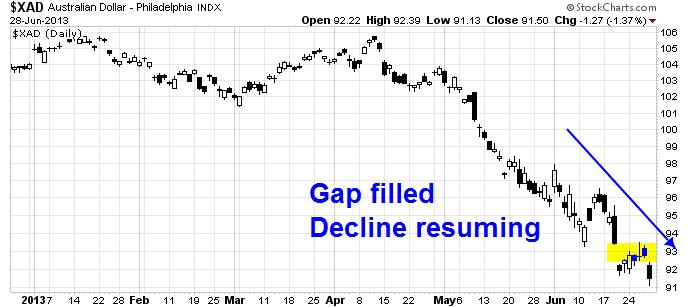
Here is the Canadian dollar, which is continue to decline with an unfilled gap: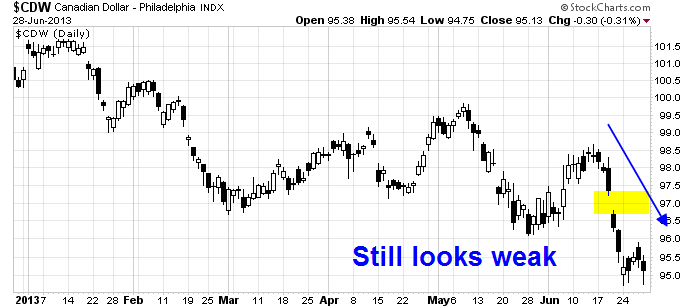
What about Europe? The chart of the SPDR Euro Stoxx 50 ETF (FEZ), below, representing eurozone equities shows that while we have seen a minor relief rally, eurozone equities have not rallied up to fill its gap.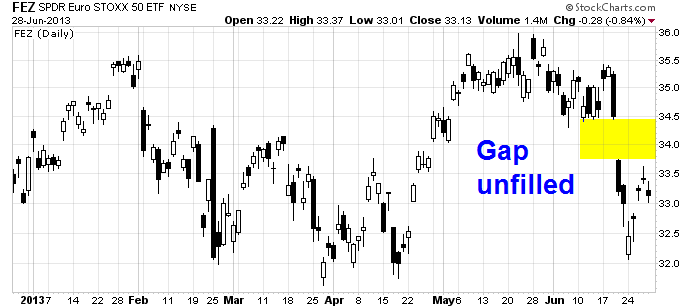
Here's the score. Sectors with filled gaps: 3; unfilled gaps: 2. My inner trader's conclusion is that the relief rally isn't quite finished yet. We are likely to see several weeks of volatility before the process is complete before the longer term fundamentals of the recalibration of risk premiums pushes asset prices lower.
Disclosure: Cam Hui is a portfolio manager at Qwest Investment Fund Management Ltd. ("Qwest"). This article is prepared by Mr. Hui as an outside business activity. As such, Qwest does not review or approve materials presented herein. The opinions and any recommendations expressed in this blog are those of the author and do not reflect the opinions or recommendations of Qwest.
None of the information or opinions expressed in this blog constitutes a solicitation for the purchase or sale of any security or other instrument. Nothing in this article constitutes investment advice and any recommendations that may be contained herein have not been based upon a consideration of the investment objectives, financial situation or particular needs of any specific recipient. Any purchase or sale activity in any securities or other instrument should be based upon your own analysis and conclusions. Past performance is not indicative of future results. Either Qwest or Mr. Hui may hold or control long or short positions in the securities or instruments mentioned.