The 2015 Q1 reporting season is underway, with results from 25 S&P 500 members already out. The reporting pace accelerates this week, with just over 90 companies announcing first-quarter results, including 34 S&P 500 members. While the Finance sector is heavily represented on this week’s reporting docket, we have enough bellwethers from other sectors to give us a good sense of this earnings season.
The overall story of Finance sector profitability is unlikely to change this earnings season, which comes across in the sector’s flat stock market performance year to date. There is no change on the net interest margins front, with a combination of low treasury yields and competition for loans keeping margins under pressure. Loan growth has been steadily improving in recent quarters, but is expected to remain seasonally soft in Q1, with positive momentum in commercial categories (commercial & industrial as well as commercial real estate) getting partly offset by weakness on the consumer side.
With respect to trading revenues, favorable earlier commentary from J.P. Morgan and Goldman Sachs has raised hopes about performance. But the overall aggregate trend for trading revenues still remains to the down side, with aggregate trading revenues declining in 14 out of the last 20 quarters.
For the Finance sector as whole, total earnings are expected to be up +9% from the same period last year, with easy comparisons at Bank of America accounting for a big part of the sector’s stronger-looking growth profile. Excluding Bank of America (NYSE:BAC) from the Finance sector, total Q1 earnings growth for the sector drops to +2.4% (from +9%).
2015 Q1 Earnings Scorecard
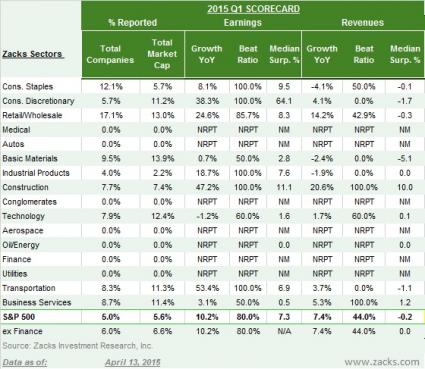
As of April 13th, we have seen Q1 result from 25 S&P 500 members (most of these companies have fiscal quarters ending in February). Total earnings for these companies are up +10.2% on +7.4% revenue gains, with 80% beating EPS estimates and 44% coming ahead of revenue expectations.

Comparing the results from these 25 S&P 500 members with what we have been seeing from the same companies in other recent quarters shows that:
1. The earnings and revenue growth rates are below what we have been seeing in other recent quarters
2. The earnings beat ratios are in-line with the preceding quarter (2014 Q4), but better than the 4-quarter average,
3. The revenue beat ratios are below what these same companies reported in the preceding as well as 4-quarter average.
The chart below shows the comparison of the results thus far with what we have been seeing from the same group of companies in other recent quarters.

The Composite Picture for Q1
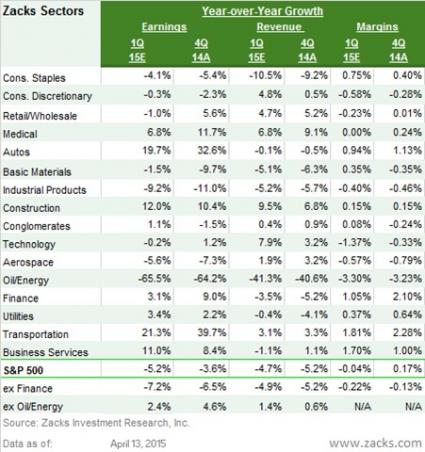
The table below presents the composite summary picture for Q1 contrasted with what companies actually reported in the 2014 Q4 earnings season. What this means is that the data below is presenting Q1 as a whole, combining the actual results from the 25 S&P 500 members that have reported results with estimates from the still-to-come 475 companies.

As you can see in the above summary table, total Q1 earnings are expected to be down -5.2% from the same period last on -4.7% lower revenues, with Energy as the biggest drag on the growth rate. Excluding Energy, total earnings for the remainder of the S&P 500 index would be up a decent enough +2.4% on +1.4% higher revenues.
Among the major sectors, Transportation, and Autos are big growth contributors this quarter, with Transportation earnings expected to be up +21.3% and Autos earnings up +19.7%. Further, Finance is up 3.1%, while Medical is up 6.8%; we should keep in mind however that a small number of companies are accounting for most of the growth for these two sectors – Finance growth is solely due to easy comparisons for Bank of America and the Medical growth is due to the strong growth at Gilead Sciences (NASDAQ:GILD) and Actavis (NYSE:ACT). Exclude these three companies from the ex-Energy growth rate for the index, we are not left with much.
Will Q1 be the Low Point for the Year?
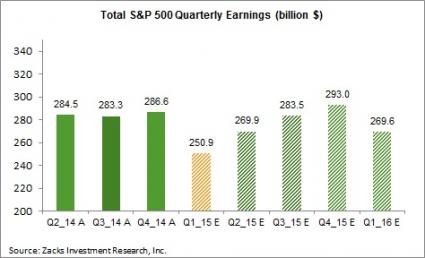
We haven’t had much earnings growth lately and the growth rate for Q1 is expected to turn negative. Not only is the growth rate for Q1 so low, but the overall level of total earnings for the S&P 500 index are also expected to be the lowest in two years. This will be a material change from the last two quarters when aggregate earnings for the index reached all-time record levels.
The chart below shows the earnings totals for 2015 Q1 (shaded orange bar - $269.9 billion) contrasted with the actual earnings for the preceding four quarters as well estimates for the following three quarters. The hopes are that Q1 will be the low point for the year, with aggregate earnings moving back into record territory towards the end of the year. Recent history tells otherwise. If history is our guide, then the likely result will be revisions to those lofty estimates in the coming days.

Note: Want more articles from this author? Scroll up to the top of this article and click the FOLLOW AUTHOR button to get an email each time a new article is published.
Note: For a complete analysis of 2015 Q1 estimates, please check out our weekly Earnings Trends report.
Here is a list of the 92 companies reporting this week, including 34 S&P 500 members.
| Company | Ticker | Current Qtr | Year-Ago Qtr | Last EPS Surprise % | Report Day | Time |
| COMMERCE BANCSH | CBSH | 0.58 | 0.64 | 6.15 | Monday | BTO |
| BANK OZARKS | OZRK | 0.45 | 0.34 | 0 | Monday | AMC |
| TRIANGLE PETROL | TPLM | 0.02 | 0.11 | 25 | Monday | AMC |
| LAYNE CHRISTENS | LAYN | -1.17 | -0.59 | 62 | Monday | AMC |
| PEP BOYS M M &J | PBY | 0.03 | -0.02 | -90.91 | Monday | AMC |
| M&T Bank Corp (NYSE:MTB) | MTB | 1.77 | 1.66 | 0.52 | Monday | N/A |
| PERFORMNC SPTS | T.PSG | N/A | -0.15 | N/A | Tuesday | BTO |
| SHAW COMM-TS | T.SJR | 0.41 | 0.46 | N/A | Tuesday | BTO |
| THERATECNOLG-TS | T.TH | -0.03 | -0.06 | N/A | Tuesday | BTO |
| WELLS FARGO-NEW | WFC | 0.97 | 1.05 | 0 | Tuesday | BTO |
| JPMORGAN CHASE | JPM | 1.38 | 1.28 | -8.46 | Tuesday | BTO |
| FASTENAL | FAST | 0.42 | 0.38 | 0 | Tuesday | BTO |
| JOHNSON & JOHNS | JNJ | 1.52 | 1.54 | 1.6 | Tuesday | BTO |
| CHINA CERAMICS | CCCL | N/A | -0.21 | N/A | Tuesday | BTO |
| THERATECHNOLGS | THERF | N/A | -0.05 | N/A | Tuesday | BTO |
| SHAW COMMS-CL B | SJR | 0.32 | 0.42 | -4.88 | Tuesday | BTO |
| PERFORMANCE SPR | PSG | 0.09 | N/A | 5 | Tuesday | BTO |
| DESTINY MDA-TS | V.DSY | N/A | -0.01 | N/A | Tuesday | AMC |
| INTEL CORP | INTC | 0.4 | 0.38 | 12.12 | Tuesday | AMC |
| CSX (NYSE:CSX) CORP | CSX | 0.45 | 0.4 | 0 | Tuesday | AMC |
| LINEAR TEC CORP | LLTC | 0.53 | 0.5 | 4.08 | Tuesday | AMC |
| DESTINY MEDIA | DSNY | N/A | -0.01 | N/A | Tuesday | AMC |
| BOSTON PRIV FIN | BPFH | 0.18 | 0.19 | -36.36 | Tuesday | AMC |
| SIMULATION PLUS | SLP | 0.07 | 0.05 | 0 | Tuesday | AMC |
| HUNT (JB) TRANS | JBHT | 0.72 | 0.58 | 4.49 | Tuesday | N/A |
| KUEHNE&NAGL INT | KHNGY | 0.28 | N/A | N/A | Tuesday | N/A |
| BANK OF AMER CP | BAC | 0.29 | -0.05 | 3.23 | Wednesday | BTO |
| PROGRESSIVE COR | PGR | 0.43 | 0.41 | 39.53 | Wednesday | BTO |
| PNC FINL SVC CP | PNC | 1.7 | 1.82 | 5.75 | Wednesday | BTO |
| US BANCORP | USB | 0.76 | 0.73 | 1.3 | Wednesday | BTO |
| DELTA AIR LINES | DAL | 0.44 | 0.33 | 4 | Wednesday | BTO |
| WATSCO INC | WSO | 0.59 | 0.48 | 9.52 | Wednesday | BTO |
| ASML HOLDING NV | ASML | 1.06 | 0.62 | 26.56 | Wednesday | BTO |
| TITAN MACHINERY | TITN | -0.19 | 0.35 | -33.33 | Wednesday | BTO |
| NETFLIX INC | NFLX | 0.68 | 0.86 | 63.64 | Wednesday | AMC |
| SANDISK CORP | SNDK | 0.59 | 1.32 | 0 | Wednesday | AMC |
| Kinder Morgan | KMI | 0.22 | 0.25 | -25 | Wednesday | AMC |
| UMPQUA HLDGS CP | UMPQ | 0.29 | 0.21 | -10 | Wednesday | AMC |
| WINTRUST FINL | WTFC | 0.74 | 0.68 | -1.32 | Wednesday | AMC |
| UNIVL FST PRODS | UFPI | 0.43 | 0.36 | 2.22 | Wednesday | AMC |
| COHEN&STRS INC | CNS | 0.53 | 0.43 | -30.61 | Wednesday | AMC |
| KEYCORP NEW | KEY | 0.26 | 0.26 | 7.69 | Thursday | BTO |
| UNITEDHEALTH GP | UNH | 1.34 | 1.1 | 3.33 | Thursday | BTO |
| GRAINGER W W | GWW | 3.14 | 3.07 | -1.06 | Thursday | BTO |
| PEOPLES UTD FIN | PBCT | 0.2 | 0.19 | 4.76 | Thursday | BTO |
| BLACKROCK INC | BLK | 4.51 | 4.43 | 2.99 | Thursday | BTO |
| CITIGROUP INC | C | 1.4 | 1.3 | -33.33 | Thursday | BTO |
| PPG INDS INC | PPG | 2.34 | 1.98 | 7.11 | Thursday | BTO |
| GOLDMAN SACHS | GS | 4.14 | 4.02 | 2.1 | Thursday | BTO |
| SHERWIN WILLIAM | SHW | 1.43 | 1.14 | 0.74 | Thursday | BTO |
| ALLIANCE DATA | ADS | 3.22 | 2.66 | 3.55 | Thursday | BTO |
| PHILIP MORRIS | PM | 1.01 | 1.19 | 23.58 | Thursday | BTO |
| FIRST REP BK SF | FRC | 0.69 | 0.73 | 0 | Thursday | BTO |
| PRIVATEBANCORP | PVTB | 0.5 | 0.44 | -6 | Thursday | BTO |
| WEBSTER FINL CP | WBS | 0.54 | 0.5 | 0 | Thursday | BTO |
| BLACKSTONE GRP | BX | 0.94 | 0.7 | 31.58 | Thursday | BTO |
| FAIRCHILD SEMI | FCS | 0.11 | 0.04 | -33.33 | Thursday | BTO |
| SONOCO PRODUCTS | SON | 0.58 | 0.52 | 3.13 | Thursday | BTO |
| HOME BANCSHARES | HOMB | 0.47 | 0.43 | 0 | Thursday | BTO |
| SANDY SPRING | SASR | 0.41 | 0.43 | -16.28 | Thursday | BTO |
| COMVERSE INC | CNSI | -0.04 | 0.46 | 247.62 | Thursday | BTO |
| NORD ANGLIA EDU | NORD | 0.25 | 0.09 | 0 | Thursday | BTO |
| COMSTOCK MINING | LODE | -0.01 | -0.07 | N/A | Thursday | BTO |
| TAIWAN SEMI-ADR | TSM | 0.48 | 0.31 | 2.04 | Thursday | BTO |
| SCHLUMBERGER LT | SLB | 0.98 | 1.21 | 2.04 | Thursday | AMC |
| AMER EXPRESS CO | AXP | 1.37 | 1.33 | 0.72 | Thursday | AMC |
| MATTEL INC | MAT | -0.09 | -0.03 | -45.83 | Thursday | AMC |
| ADV MICRO DEV | AMD | -0.06 | 0.02 | -100 | Thursday | AMC |
| ASSOC BANC CORP | ASB | 0.29 | 0.27 | 3.33 | Thursday | AMC |
| EASTGROUP PPTYS | EGP | 0.87 | 0.82 | 0 | Thursday | AMC |
| CELANESE CP-A | CE | 1.32 | 1.33 | 7.56 | Thursday | AMC |
| CROWN HLDGS INC | CCK | 0.51 | 0.57 | 0 | Thursday | AMC |
| CYTEC INDS INC | CYT | 0.72 | 0.71 | 8.2 | Thursday | AMC |
| SERVICENOW INC | NOW | -0.31 | -0.19 | 11.11 | Thursday | AMC |
| STREAMLINE HLTH | STRM | -0.16 | -0.13 | -27.27 | Thursday | AMC |
| AMER RIVER BSH | AMRB | 0.12 | 0.12 | 15.38 | Thursday | AMC |
| CHEROKEE INC | CHKE | 0.17 | 0.2 | 22.73 | Thursday | AMC |
| INDEP BK MASS | INDB | 0.6 | 0.51 | 2.99 | Thursday | AMC |
| BANCO LATINOAME | BLX | 0.72 | 0.61 | 27.4 | Thursday | AMC |
| SIGNATURE GROUP | SGRH | -0.27 | -0.06 | N/A | Thursday | AMC |
| ULTRAPETROL LTD | ULTR | -0.02 | -0.03 | N/A | Thursday | AMC |
| COBIZ FINL INC | COBZ | 0.17 | 0.13 | -5.56 | Thursday | N/A |
| CONS PORTFOLIO | CPSS | 0.25 | 0.21 | N/A | Thursday | N/A |
| COMERICA INC | CMA | 0.72 | 0.73 | 6.49 | Friday | BTO |
| HONEYWELL INTL | HON | 1.39 | 1.28 | 0.7 | Friday | BTO |
| SEAGATE TECH | STX | 1.08 | 1.34 | -0.74 | Friday | BTO |
| GENL ELECTRIC | GE | 0.3 | 0.33 | 1.82 | Friday | BTO |
| SYNCHRONY FIN | SYF | 0.65 | 0.63 | 8.47 | Friday | BTO |
| MEDGENICS INC | MDGN | -0.34 | -0.28 | -36.36 | Friday | BTO |
