Get 40% Off
🚀 AI-picked stocks soar in May. PRFT is +55%—in just 16 days! Don’t miss June’s top picks.Unlock full list

PZZA Stock Chart Hides An Elliott Wave Message

Published 06/18/2018, 04:51 AM
Updated 07/09/2023, 06:31 AM
PZZA
-

Papa John's (NASDAQ:PZZA), founded in 1984 and headquartered in Louisville, Kentucky, operates approximately 5 200 pizza restaurants globally. The company went public on the NASDAQ stock exchange in 1993 under the ticker symbol PZZA and reached its all-time high of $90.49 in December 2016. Unfortunately, no trend lasts forever and PZZA stock was a big disappointment lately, falling by over 36% in 2017. Investors thought 2018 will bring some relief, but the share price has tumbled by another 11.7% year to date.

In order to find out what to expect from now on, we need to take a look at the daily chart of PZZA stock through the prism of the Elliott Wave Principle. There seems to be a hidden message in the wave structure of the plunge from $90.49 in 2016.
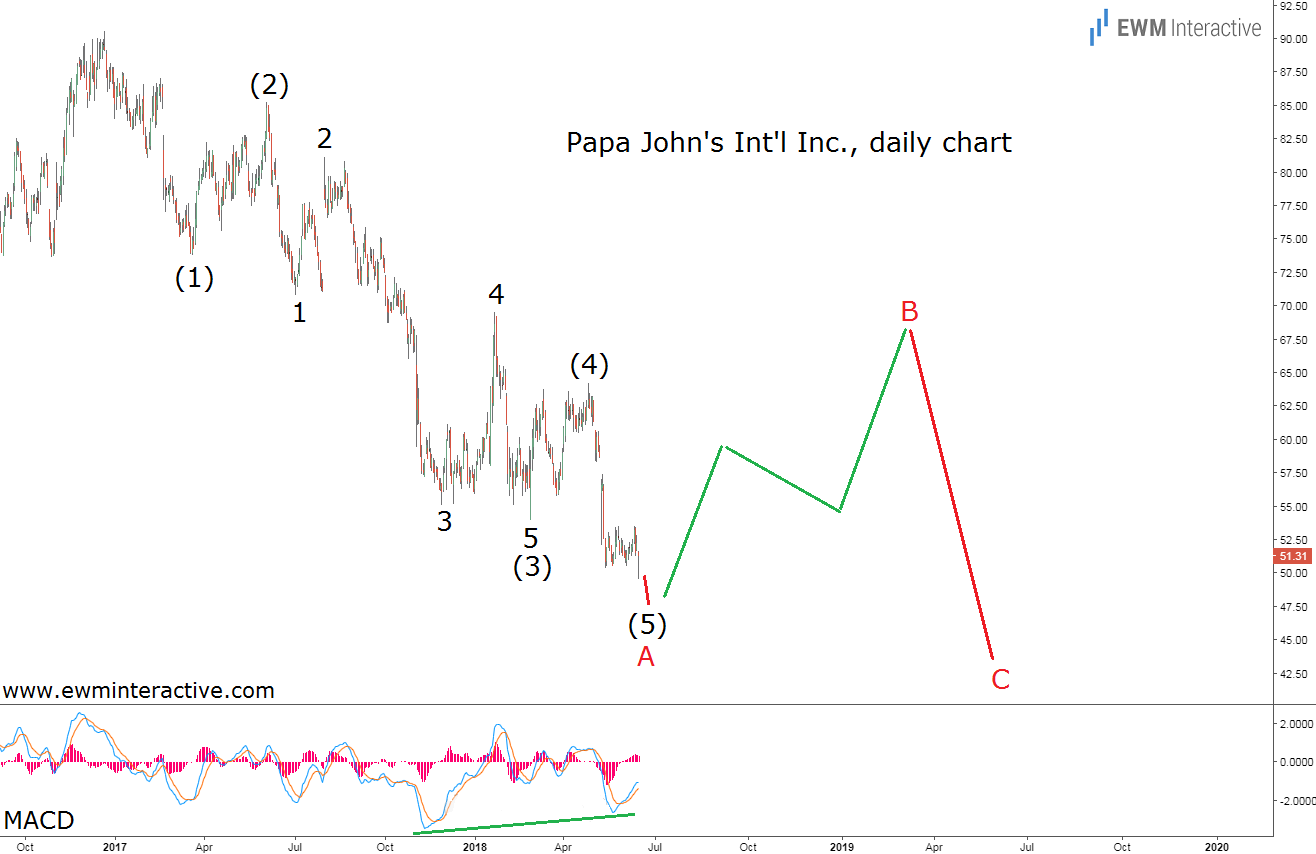
Pzza Stock Elliott Wave Analysis
The daily chart of Papa John’s stock reveals a textbook five-wave impulse, labeled (1)-(2)-(3)-(4)-(5). Wave (3) is extended, so its five sub-waves are also visible. The first thing this pattern tells us is that PZZA stock has entered a larger bear market, which is still not over. According to the theory, impulses develop in the direction of the bigger sequence. Since this five-wave decline follows a multi-year uptrend, chances are it fits into the position of wave A of a simple A-B-C zigzag correction with waves B and C remaining. The bad news is that wave C is going to drag the price even lower before the uptrend could resume.

On the positive side, wave B should first lift PZZA stock to the resistance near $70 a share, implying roughly 40% upside from current levels. The MACD indicator also suggests a reversal should soon be expected by showing a bullish divergence between waves (3) and (5). If this is the correct count, the rest of 2018 should look a lot better than its first half.

Original post

Latest comments

Loading next article…
Risk Disclosure: Trading in financial instruments and/or cryptocurrencies involves high risks including the risk of losing some, or all, of your investment amount, and may not be suitable for all investors. Prices of cryptocurrencies are extremely volatile and may be affected by external factors such as financial, regulatory or political events. Trading on margin increases the financial risks.
Before deciding to trade in financial instrument or cryptocurrencies you should be fully informed of the risks and costs associated with trading the financial markets, carefully consider your investment objectives, level of experience, and risk appetite, and seek professional advice where needed.
Fusion Media would like to remind you that the data contained in this website is not necessarily real-time nor accurate. The data and prices on the website are not necessarily provided by any market or exchange, but may be provided by market makers, and so prices may not be accurate and may differ from the actual price at any given market, meaning prices are indicative and not appropriate for trading purposes. Fusion Media and any provider of the data contained in this website will not accept liability for any loss or damage as a result of your trading, or your reliance on the information contained within this website.
It is prohibited to use, store, reproduce, display, modify, transmit or distribute the data contained in this website without the explicit prior written permission of Fusion Media and/or the data provider. All intellectual property rights are reserved by the providers and/or the exchange providing the data contained in this website.
Fusion Media may be compensated by the advertisers that appear on the website, based on your interaction with the advertisements or advertisers.
© 2007-2024 - Fusion Media Limited. All Rights Reserved.