The three key players in the competition to develop a mobile ecosystem are Apple (AAPL), Microsoft (MSFT) and Google (GOOG).
“Ecosystem” generally refers to a one company source for interoperable, mobile phones, tablets, laptop or desktop computers, operating systems, app stores, and cloud storage.
Google and Microsoft are imitating Apple’s success with an ecosystem, but each has their own twist. Google is moving toward wearable computing and Microsoft is moving toward mobile productivity and corporate connectivity.
We think Google could become the next runaway success with the introduction of wearable mobile computing through Google Glass in 2014-2015. When and how they will have calling connections through telecomm carriers is unclear at this point. However, wearable mobile devices and freeing of the hands as is expected to eventually become the case with Google Glass would be a disruptive change that would challenge Apple’s domain.
Apple is the top dog now, and is growing well, with tremendous opportunity in China if they can get onto the China Mobile (CHL) platform.
Microsoft, with the introduction of their Surface Pro tablets in 2013 will have the edge for those who want full productivity capability in a tablet for word processing and spreadsheets with a fold out keyboard.
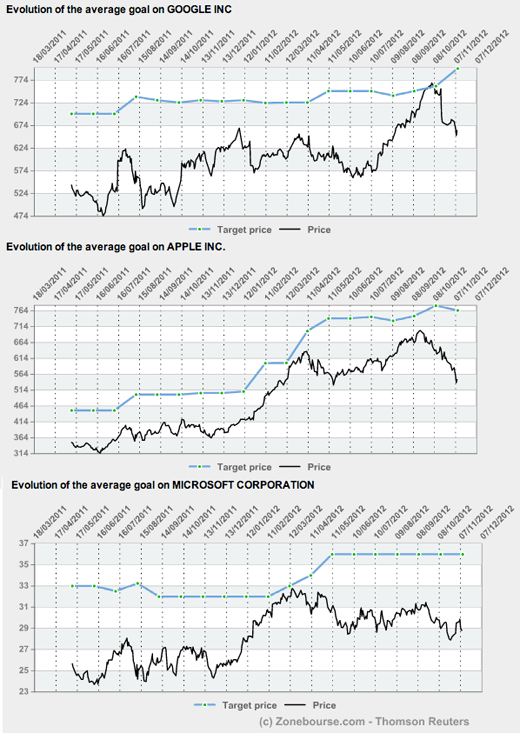
This chart shows the evolution of the price of GOOG, AAPL and MSFT versus the average street analyst 1-year target price over the past 18 months. The data is as of 2012-11-09, is from 4-traders.com using data from ThomsonReuters.
Target prices for GOOG are rising, falling for AAPL and flat for MSFT.
For GOOG there are 42 analysts with a $798 average target price, which is about 20% above the current price (yield = 0%, EV/EBIDTA =11.43, PEG = 1.24).
For AAPL there are 57 analysts with a $764 average target price, which is about 40% above the current price (yield = 2.00%, EV/EBITDA = 8.30, PEG = 0.50).
For MSFT there are 38 analysts with a $35.40 average target price, which is about 23% above the current price (yield = 3.20%, EV/EBITDA = 6.56, PEG = 1.11).
The current ThomsonReuters StarMine analyst ratings for the three companies (rating scale 0-10, worst to best), and the S&P Stars Rating for year ahead price performance (1-5 worst to best) / Fair Value Rating (1-5 worst to best) are as follows:
- GOOG: 2.9; 3/5
- AAPL: 7.4; 4/4
- MSFT: 8.3; 5/5
The Beta for the three varies with Microsoft lowest and Apple highest:
- GOOG: 1.09
- AAPL: 1.22
- MSFT: 1.01
The Put/Call Ratio shows the most concern about GOOG and the least about MSFT. The 1-day / 30-day Put/Call Ratios (as of Nov. 9, 2012) were:
- GOOG: 1.2/1.0
- AAPL: 0.8/0.6
- MSFT: 0.5/0.6
The Put/Call Ratio for GOOG and APPL were higher than the 30-day average last Friday, while the ratio for MSFT was lower.
