In last week’s note we reiterated our case from October that the “pain trade” was UP in the first half of this year DESPITE the short-term seasonal headwinds and possibility of near-term weakness (read full note for context):
I am fully aware that after taking such an unconventional position in the Fall - and following up with this note prospectively - that the market is likely to consolidate/pull back within minutes of me hitting the "publish" button! However, what may or may not happen in the short term has nothing to do with what happens in the next 6-12 months and we are constructive irrespective of any short-term noise/digestion:
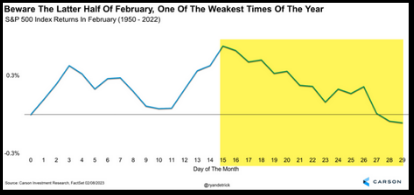
source : Ryan Detrick
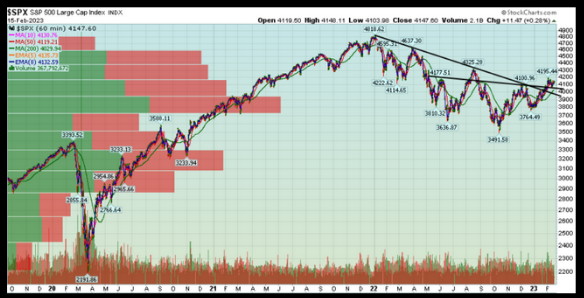
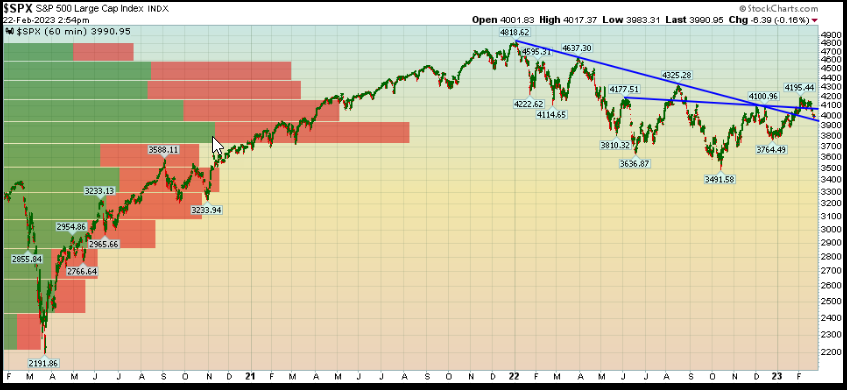
Here’s what the chart above looks like this week:
On Tuesday (during the 700pt DOW flush), I joined Seana Smith and Dave Briggs on Yahoo! Finance. Thanks to Taylor Clothier, Sydnee Fried, Dave and Seana for having me on the show.
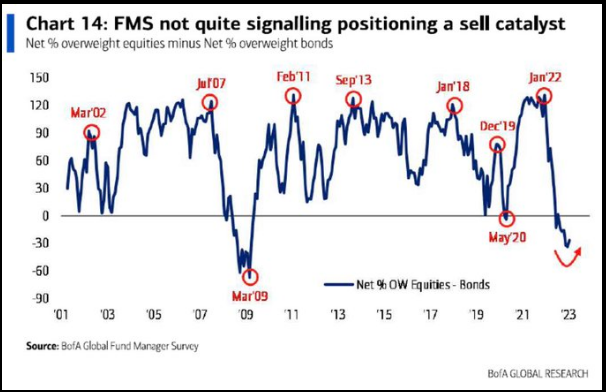
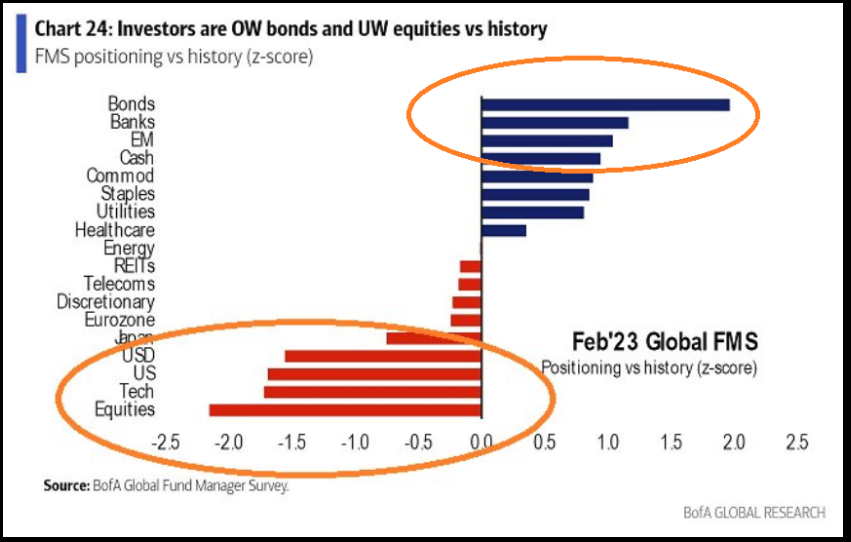
Key Takeaway from the segment: “Bears should curb their enthusiasm. This is a normal consolidation after an ~18.5% rally off the October lows in a period of (end of Feb.) seasonal weakness. Markets don’t TOP when everyone is overweight BONDS, they top when everyone is overweight STOCKS…”
Here is some of the rental data I reference:
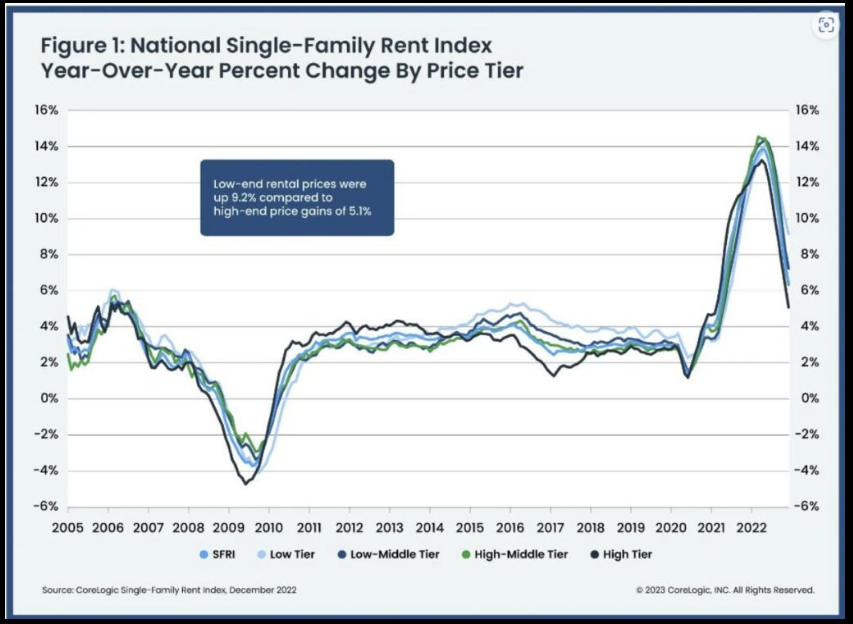
Source: CoreLogic via Seth Golden
Here’s a visual of household balance sheets (declining but historically peerless):
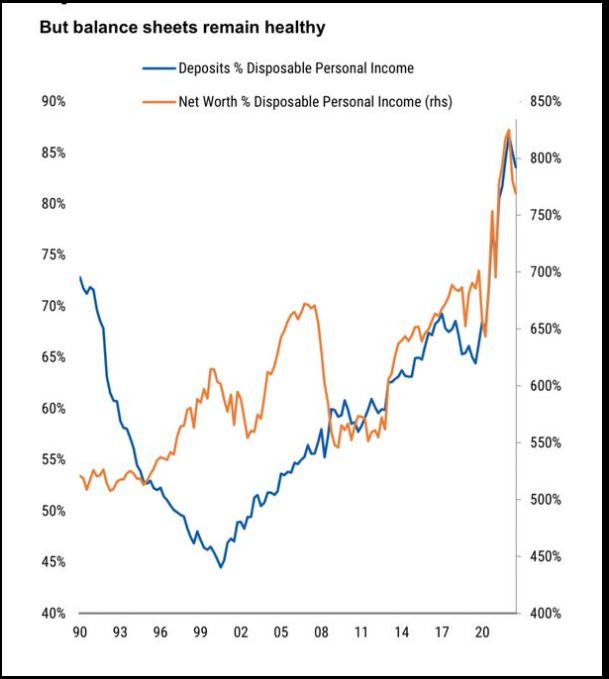
Source: Morgan Stanley (NYSE:MS)
On Friday I joined Cheryl Casone in-studio to talk markets, positioning, inflation and opportunities on Fox Business – The Claman Countdown. Thanks to Kathryn Meyers, Cheryl and Liz Claman for having me on:
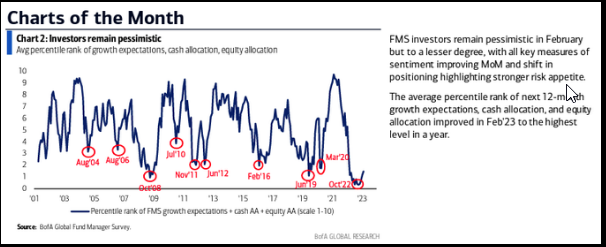
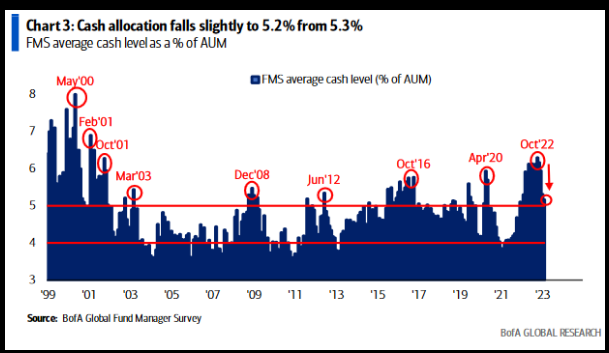
Data Referenced in Segment:
And finally, on Friday evening I joined Phillip Yin on CGTN America to discuss inflation and markets. Thanks to Longwei Zheng and Phil for having me on:
Pretty, Pretty, Pretty Good…
While most of what you have found in the last few months is negativity, here are some concepts we’ve been reminding viewers of in our weekly podcast|videocast.
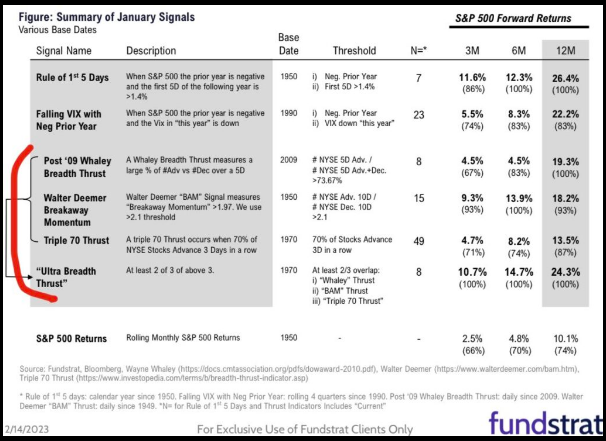
This weekend I spoke at the MoneyShow. One of the other speakers was Jeff Hirsch of the legendary “Stock Traders Almanac.” You may remember this table we put out all of January – pointing to good things for 2023:
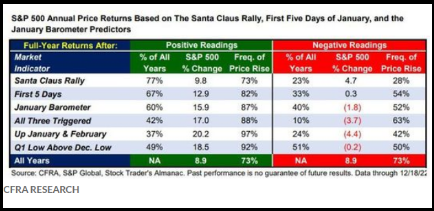
In Jeff’s presentation, he presented a number of slides that speak to this statistical advantage – which point to good things to come:
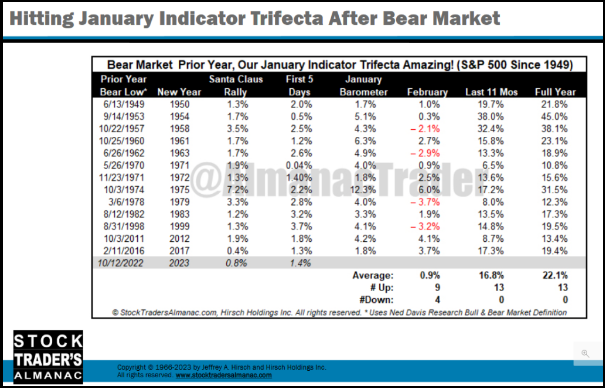
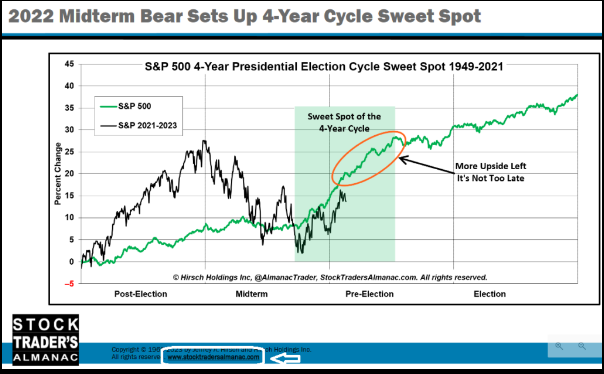
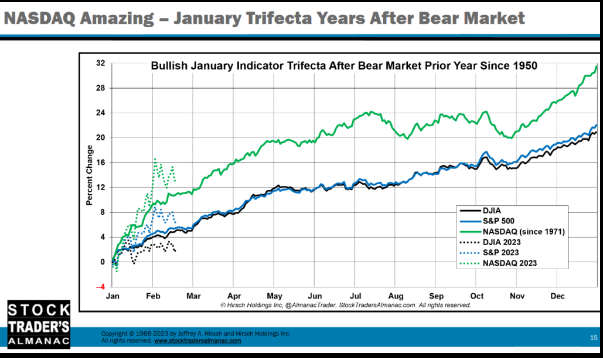
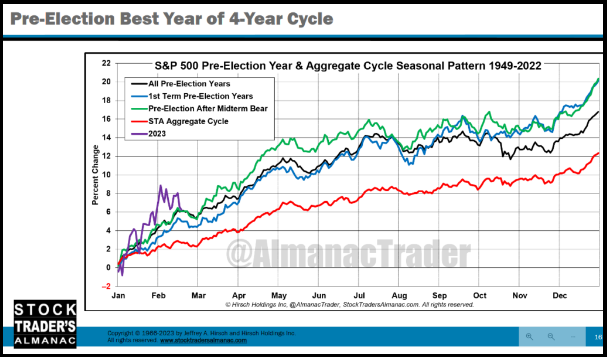
All courtesy of Jeff Hirsch at StockTradersAlmanac.com
The trend is your friend:
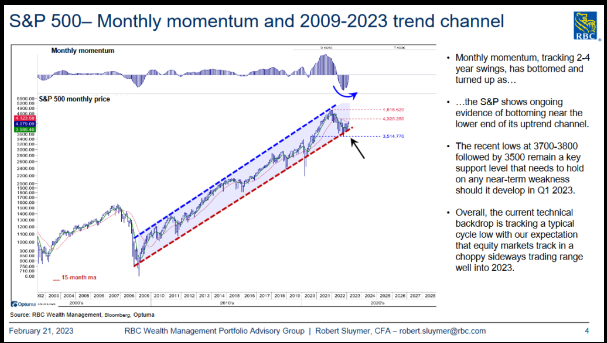
Source: RBC (TSX:RY)
Labor supply coming back online:
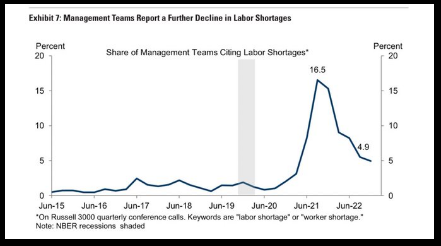
The “Last Shall Be First” theme we highlighted in our notes in Q4 is playing out in spades:
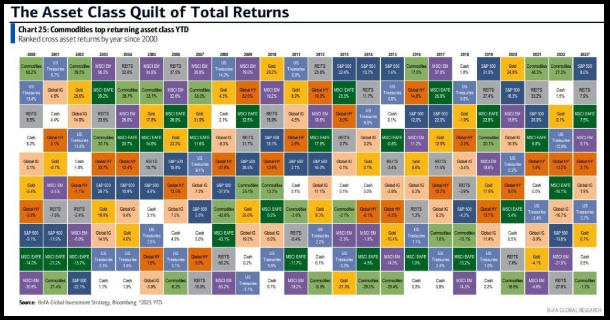
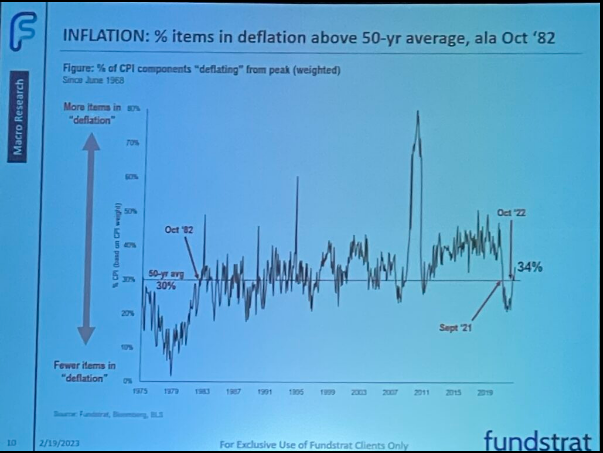
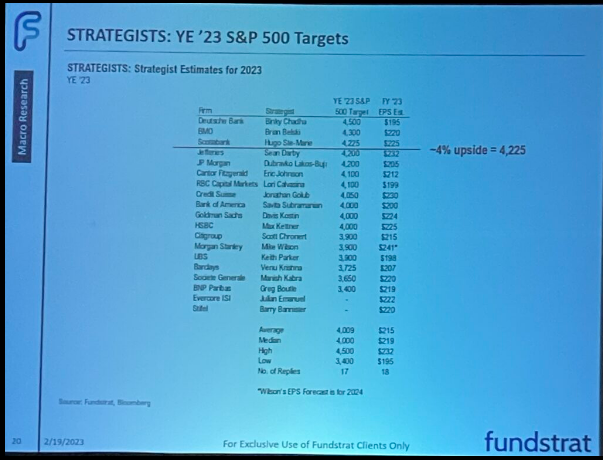
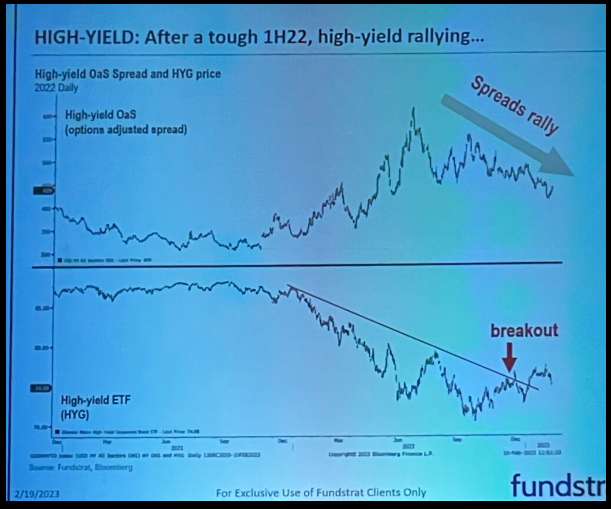
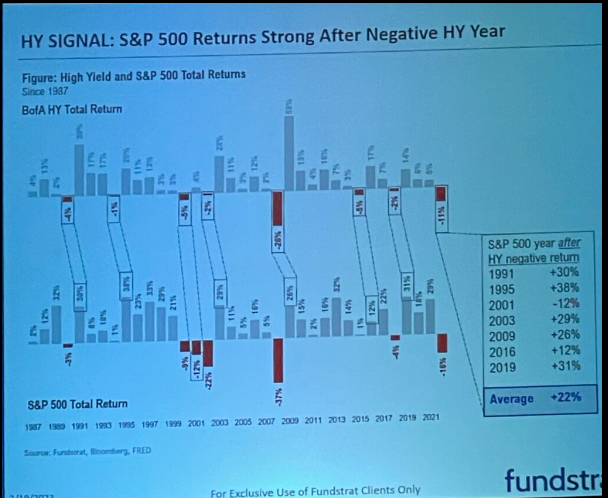
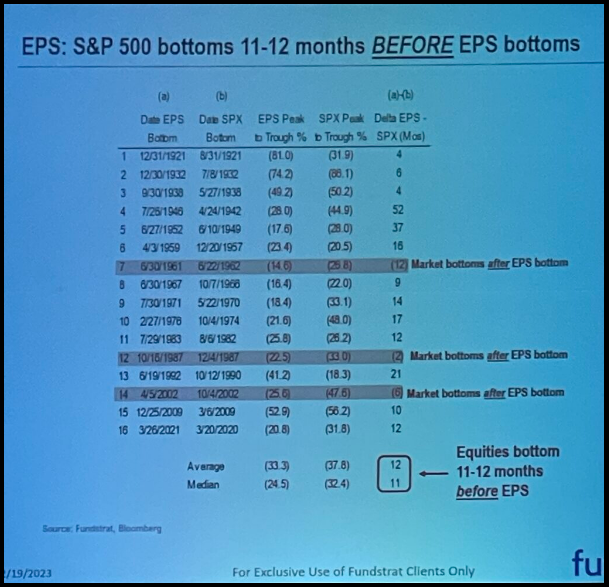
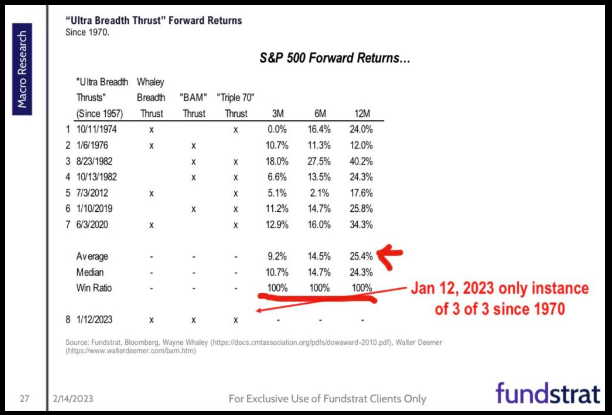
Tom Lee was a KeyNote speaker at the MoneyShow this weekend. Here are some of his best slides from FundStrat.com. We’ve talked about these themes in recent months and here is the latest data:
CPI components in deflation above 30% = positive signal:
Wall Street Pessimism Pervasive:
High Yield Market is Healing:
HY Signal for Equity Markets after negative year:
Stock Market Bottoms Well Before Earnings:
Market Breadth is improving:
In our view, despite the short term consolidation, the intermediate term outlook for equities is:
Now onto the shorter term view for the General Market:
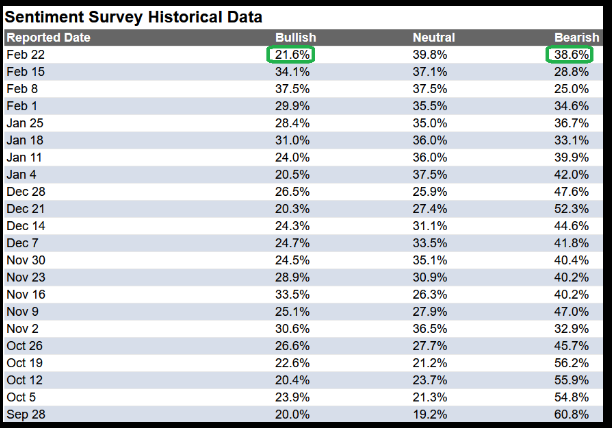
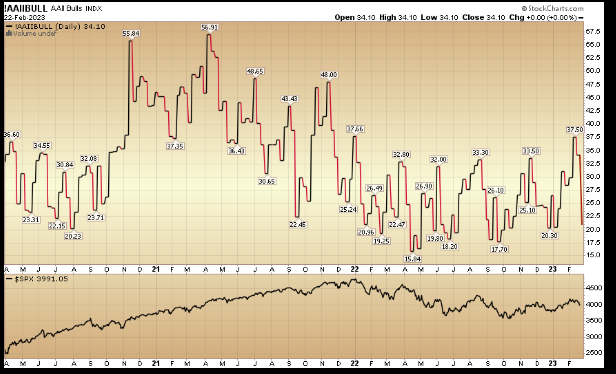
In this week’s AAII Sentiment Survey result, Bullish Percent (Video Explanation) collapsed to 21.6% from 34.1% the previous week. Bearish Percent jumped to 38.6% from 28.8%. I have rarely seen retail investors panic this much, this quickly.
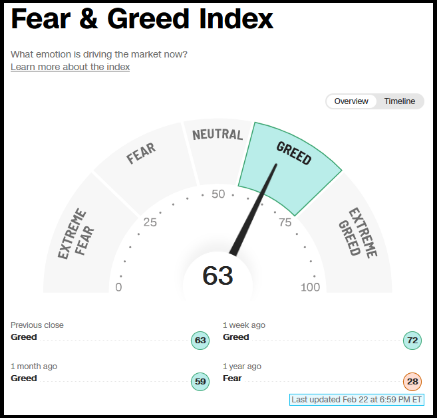
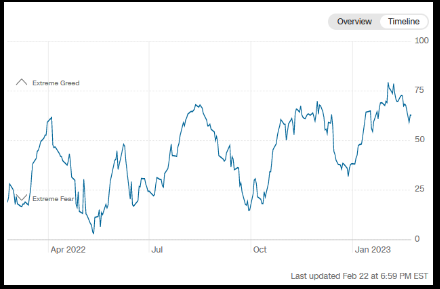
The CNN “Fear and Greed” dropped from 74 last week to 63 this week. Sentiment cooled. You can learn how this indicator is calculated and how it works here: (Video Explanation)
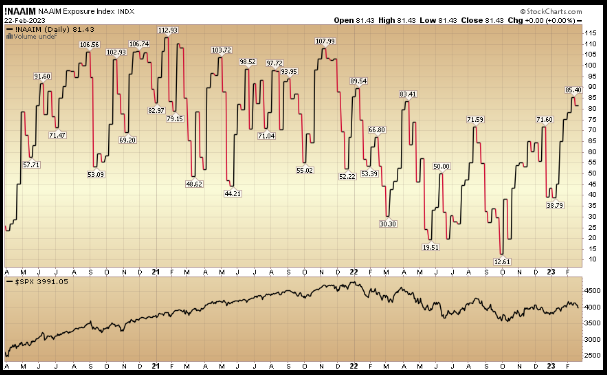
And finally, the NAAIM (National Association of Active Investment Managers Index) (Video Explanation) ticked down to 81.43% this week from 85.4% equity exposure last week.
This content was originally published on Hedgefundtips.com.
