
Prestige Consumer Healthcare, Inc. (NYSE:PBH) came out with fourth-quarter fiscal 2019 results, wherein both top and bottom lines surpassed the Zacks Consensus Estimate. Shares of the company gained 2.7% on the better-than-expected results.
While the bottom line grew year over year, sales declined for the fourth straight quarter. Dismal sales trend has caused this Zacks Rank #4 (Sell) stock to fall 14% in a year’s time, underperforming the industry’s decline of 10.9%.

Q4 Details
The company posted adjusted earnings of 72 cents per share, up 16.1% from the year-ago quarter’s 62 cents. This upside can be attributed to solid consumption trends at the core brands. Also, the figure surpassed the Zacks Consensus Estimate of 70 cents and marked its fifth consecutive quarter of earnings beat.
Total revenues of $241 million exceeded the Zacks Consensus Estimate of $237 million. Although the top line dropped 5.8% year over year, organic revenues rose 3.2% on the back of robust consumption trends at core categories and changes in revenue accounting policies. We note that organic revenues don’t include the impact of the sale of the Household Cleaning segment and foreign currency movements.
Gross profit came in at $138.2 million, reflecting a decline of 2.1% from the prior-year quarter’s figure. However, gross margin expanded 150 basis points (bps) to 56.9% in the fiscal fourth quarter, primarily driven by the divestiture of the Household Cleaning segment, partly negated by the redesigned BC and Goody’s packaging and certain costs related to the aforementioned divestiture.
Adjusted EBITDA was $83.7 million, down 1.8% year over year, owing to the Household Cleaning segment divestiture. Adjusted EBITDA margin expanded 140 bps to 34.7%.
Segment Performance
Following the divestiture of the Household Cleaning segment on Jul 2, 2018, Prestige Consumer is currently operating two segments — the North American OTC Healthcare and the International OTC Healthcare.
Revenues in the North American OTC Healthcare segment amounted $214.9 million, up 1.3% year over year on the back of increased consumption at core categories and changes in revenue accounting policies.
Revenues in the International OTC Healthcare segment totaled $26.1 million, up 8.3% from the year-ago quarter. The rise was attributable to increased consumption at core categories, and timing of shipments and distributor orders, which were partly negated by currency headwinds to the tune of $1 million.
Financial Updates
The company exited the quarter under review with cash and cash equivalents of $27.5 million, net long-term debt of $1,798.6 million and shareholders’ equity of $1,095.8 million. Also, the company lowered its debt by $200 million in fiscal 2019. Net cash provided by operating activities in the fiscal year was $189.3 million.
Business Development
Management approved a share repurchase program worth $50 million. Under this plan, Prestige Consumer can buyback shares through May 2020.
Prestige Consumer Healthcare Inc. Price, Consensus and EPS Surprise
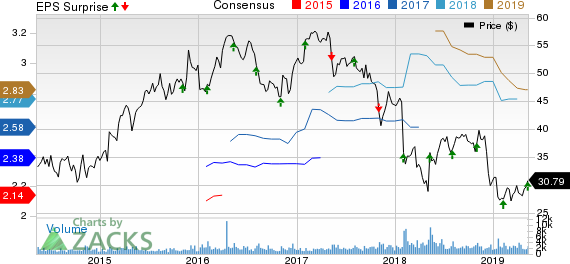
Prestige Consumer Healthcare Inc. price-consensus-eps-surprise-chart | Prestige Consumer Healthcare Inc. Quote
Outlook
Management issued fiscal 2020 guidance, wherein it anticipates growth in product categories to be offset by lower retail inventory and consolidation plans. Owing to these factors, organic growth is projected to be flat year over year in fiscal 2020.
In fiscal 2020, the company expects revenues of $951-$961 million and adjusted earnings per share of $2.76-$2.83. In this regard, the company highlighted that adjusted earnings will be more in the second half of fiscal 2020 due to increased A&P and G&A spending in the first half. Additionally, free cash flow is forecasted to be $200 million or more in the said period.
Moving on, Prestige Consumer is on track with its three core strategies, and also making efforts to maintain a strong financial profile and maximize capital allocation. Proceeds from capital allocation efforts will enable the company to reduce debt to some extent and repurchase shares up to $50 million.
Stocks to Consider
Steve Madden (NASDAQ:SHOO) , carrying a Zacks Rank #2 (Buy), has long-term growth rate of 9%. You can see the complete list of today’s Zacks #1 Rank stocks here.
Columbia Sportswear Co. (NASDAQ:COLM) , carrying a Zacks Rank #2, has long-term growth rate of 8.9%.
Under Armour (NYSE:UAA) , with long-term earnings per share growth rate of 20.8%, carries a Zacks Rank #2.
Biggest Tech Breakthrough in a Generation
Be among the early investors in the new type of device that experts say could impact society as much as the discovery of electricity. Current technology will soon be outdated and replaced by these new devices. In the process, it’s expected to create 22 million jobs and generate $12.3 trillion in activity.
A select few stocks could skyrocket the most as rollout accelerates for this new tech. Early investors could see gains similar to buying Microsoft (NASDAQ:MSFT) in the 1990s. Zacks’ just-released special report reveals 7 stocks to watch. The report is only available for a limited time.
See 7 breakthrough stocks now>>
Prestige Consumer Healthcare Inc. (PBH): Free Stock Analysis Report
Steven Madden, Ltd. (SHOO): Free Stock Analysis Report
Under Armour, Inc. (UAA): Free Stock Analysis Report
Columbia Sportswear Company (COLM): Free Stock Analysis Report
Original post
Zacks Investment Research