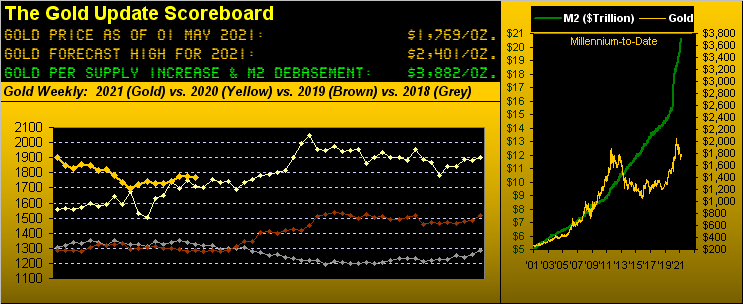
Let's admit it right off the top: Gold did not reach our anticipated near-term target of at least 1800.
"Well the week's intra-day high of 1790 was pretty close, mmb..."
Very sporting of you there, Squire. However: we've been leaping and pom-pomming about now for better than a month toward Gold returning to 1800 and it hasn't happened, even with the Triple Top setup for a pop per our prior missive. And arguably your noting 1790 having just traded, one might opt that 'tis a quadruple top.
But at the end of the day (in this case the week), Gold per yesterday's (Friday's) settle at 1769 reflects price having lost some of its shine. Moreover, a bevy of Gold technicals have just turned negative, although we just cannot conceive in any fundamental way too much of a material price decline.
Worse, the "in thing" this Spring is some compelling urge amongst analysts et alia to compare Gold with bits***t as a store of value! The very notion of that is sufficiently disgusting as to heave one's cookies at such sacrilege! What are these people thinking?
"They're not, mmb..."
Absolutely right, Squire. Such manias merely add to the many signs of a wholesale topping for horribly overvalued markets and assets. By which let's segue to our title.
Remember ole James Earl Carter Jr.? We do. The night he was elected U.S. President back in '76, my roommate at The University of Spoiled Children (U$C) said "This can't be good...", straightaway grabbed Grandpa Hugh Baillie's sterling silver mixer and filled it with crushed ice, Tanqueray and a splash of Noilly Prat.
Gold that day (02 November '76) was priced at 125, the annualized rate of inflation was 5.7%, and the "prime" lending rate was 6.50%. Come Election Day four years hence (04 November '80) Gold was 660, inflation 11.3%, and "prime" 15.50%.
We mention this as, upon learning the context of President Joe "Nikita" Biden's address this past Wednesday night, we thought: "Here we go again..."
For you know, and we know, and everyone with a brain from Bangor, Maine to Honolulu and right 'round the globe knows that "greater government investment" is akin to that in pyrite (aka "fool's gold"); but its stagflationary ramifications bode well for real Gold, (as is made obvious in the preceding paragraph). "Pass the peanuts and Billy Beer" and let the long, sorry sloth begin.
And we can start with Thursday's release of Q1 Gross Domestic Product: +6.4% "Oh, Yes!" Uh, but wait: the Chain Deflator was +4.1% "Oh, nooo..." That's its largest reading since Q1 of 2007, a year after which it all went wrong, albeit due to massive overextension of unrepayable credit. And how about Thursday's report for March's Core Personal Consumption Expenditures Index: 'tis the Federal Reserve's favoured read on inflation, and at +0.4% for the month, that annualized reading of +4.8% is more than double the Fed's target of +2.0%. But such inflation is "transitory" says the FedHead. On verra...
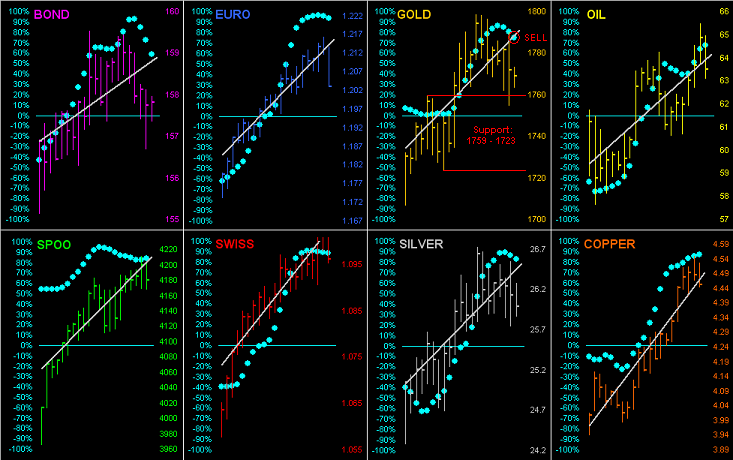
What we do know is—at least by the below graphic of the BEGOS Markets from one month ago-to-date—one might deduce "the rising tide of inflation is lifting all boats." Every grey trendline is firmly up. BUT: look at Gold's baby blue dots of linear regression trend consistency: they've just slipped sub-80% which infers lower prices near-term, (thus generating the word "SELL"). Yet as noted, we don't see too much downside given the structural support zone of 1759-1723. Mind Silver as well, for her "Baby Blues" have begun also to slip:
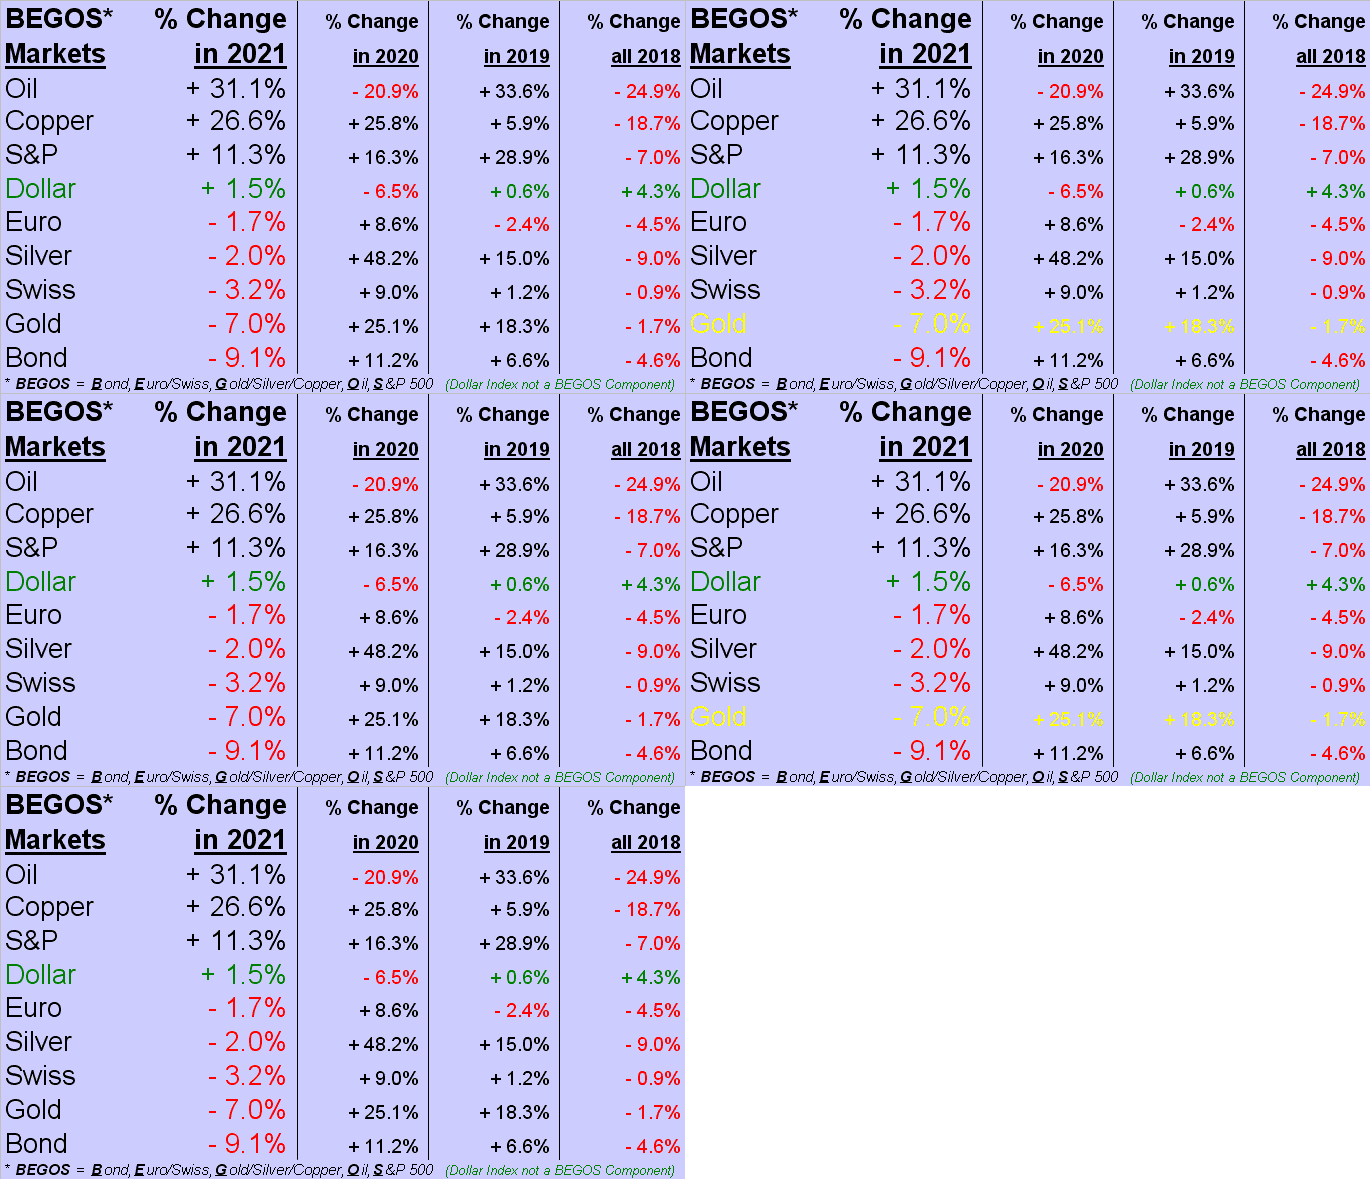
As for the BEGOS Markets Standings year-to-date, every component is in the same position as 'twas at March's end. Of particular interest therein is Copper. You website followers out there know that for each subsequent trading day is posted a "guesstimate" of the "high if an up day" or "low if a down day." For Copper (as is normal for all the components), a "low if a down day" typically is achieved once per week in prices' normal ebb and flow. However: Copper has not touched its "low if a down day" for 27 consecutive trading days: that's akin to falling off the end of the Bell Curve. Which means we're expecting an imminent falling off of the Copper price. ("And as goes Copper..."). Nuff said. Here are the Standings:
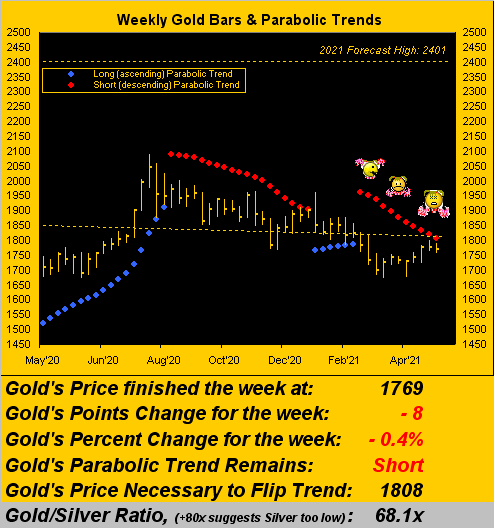
Now to another Gold technical negative as we turn to the weekly bars from one year ago-to-date: the diagonal dashed trendline has noticeably rotated to negative for the first time in over two years (since the week ending 23 March 2019). Further, in price not near-term achieving at least 1800, the parabolic trend remains Short, although the reduced flip price to 1808 is still within the expected weekly trading range of 55 points from the present 1769 level. That noted however, Gold's parabolic trend on its daily bars just confirmed flipping from Long to Short per Friday's close, again suggesting a reasonable test of the 1759-1723 structural support zone:
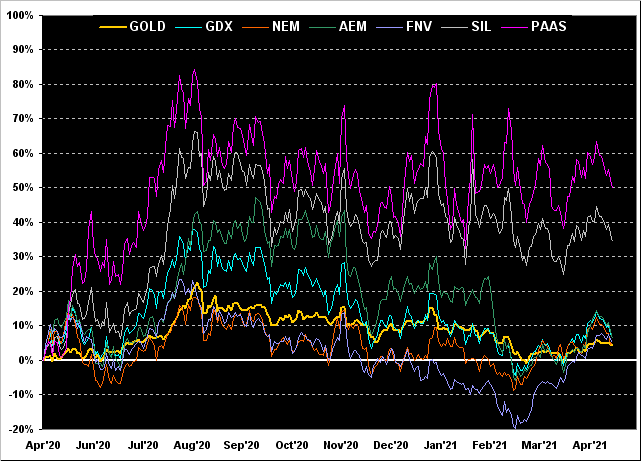
And it being month-end, let's also go year-over-year with the percentage tracks for Gold and the high-level metals equities. Note that 'tis the two Silver representatives that have out-paced the Golds. From top-to-bottom we've Pan American Silver (NASDAQ:PAAS) +50%, the Global X Silver Miners exchange-traded fund (NYSE:SIL) +34%, then falling off to the VanEck Vectors Gold Miners exchange-traded fund (NYSE:GDX) +7%, Agnico Eagle Mines (NYSE:AEM) +6%, both Franco-Nevada (NYSE:FNV) and Newmont (NYSE:NEM) +5%, and Gold itself +4%.
Of note: Q1 Earnings Season has thus far been very metals-favorable, NEM's bottom line nearly double what was earned year ago, and that for AEM nearly triple. Here's the graphic:
Now as we turn to the Economic Barometer, let's present you with the usual scary stat: our "live" price/earnings ratio for the S&P 500 now sits at 73.2x. One year ago to the day, such P/E was 35.7x (yes, even that being outrageously "high" by business school standards). The S&P 500 a year ago was 2912, but today is 4181, +44%. So: the P/E having more than doubled means that "implied earnings" for the S&P 500 have actually declined from this day a year ago. (And yes, that's still the case even if we exclude Tesla (NASDAQ:TSLA) from the S&P 500!) Here's a thought: "Got Gold???"
And here's the Baro replete with its robust (as expected) week...
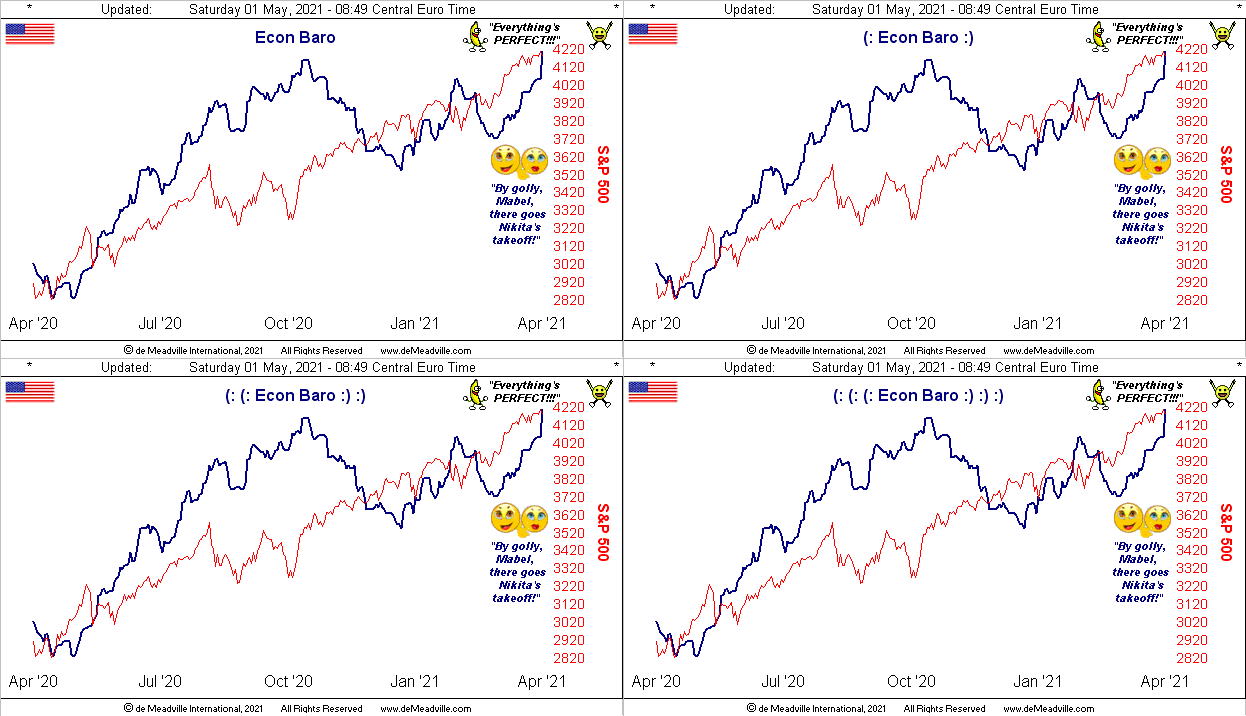
... as the "boom", the "vigorous rebound", and the "takeoff" (in the words of Dow Jones Newswires) "at the expense of businesses and the wealthy" all come to fruition. (Hilarious, even if historically proven horrendous). More peanuts and beer, please.
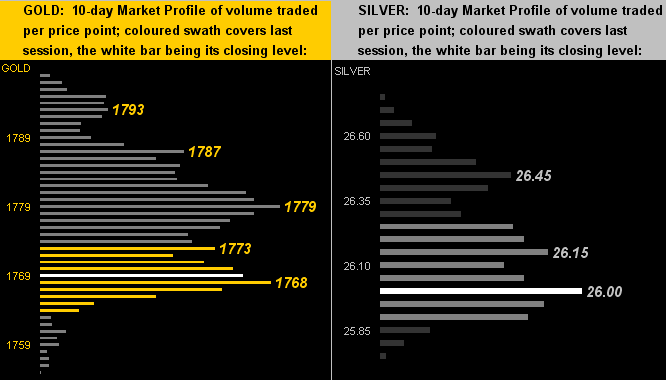
But crying in one's beer we fear are the prices of the precious metals as we turn to their 10-day Market Profiles. Clearly for Gold on the left, the 1768 level appears as the final near-term price of dominant trading volume support, (notwithstanding the aforementioned 1759-1723 structural support zone). And as for Silver on the right, 26 remains her key fix, though she may dive to 25 given Gold losing a bit of jive:
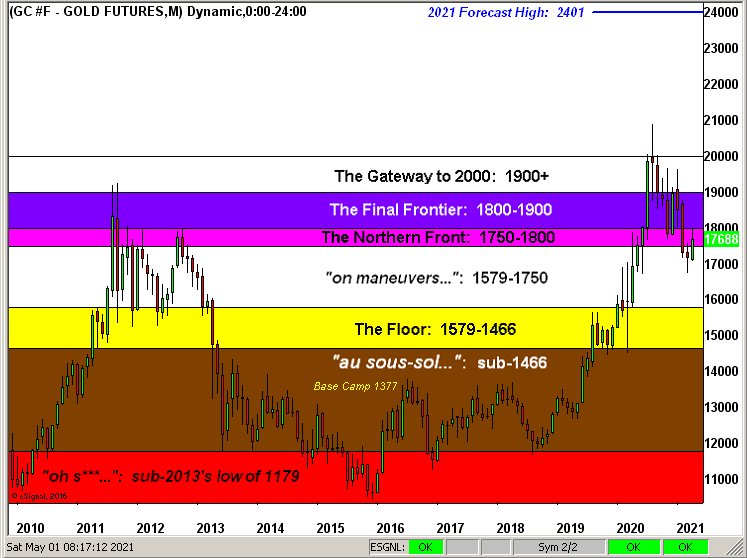
Again it being month's-end, 'tis time to bring up Gold's Structure from 2010-to-date by the monthly bars. Price has been revisiting haunts of long ago, "The Northern Front" notably so. And a near-term pullback notwithstanding, we're maintaining our forecast high for this year at 2401 with eight months in the balance:
So on the surface, everything's great. Below the surface it looks to stagflate. Might Jimmy (still blessedly with us at 96) chime in to articulate? To be sure, Gold near-term looks to abate, but make sure you've yours before 'tis too late!