
At the end of July we wrote an article examining the relationship between gold stocks and general equities. We sought to understand the huge variance in performance between the two markets. Sometimes they trended higher together. Sometimes the gold stocks surged while conventional equities fell into a bear market. Both markets have endured bad bears at the same time. Is there any rhyme or reason to why such variation?
Here was our conclusion:
What can history tell us going forward? The key is the correlation. If gold stocks are trending higher with the equity market into a potential recession and bear market, then the gold stocks would remain positively correlated over the intermediate term. However, we can see that if the gold stocks are in a cyclical bear while the broad market is nearing a trend reversal or while the economy is nearing recession, then the gold stocks will remain negatively correlated. This is evident in three of the four previous examples.
Interestingly, two of those instances occurred during the second half of the 1960-1980 bull market. The equity market (Dow) is in blue while the Barron’s Gold Mining Index (BGMI) is in red.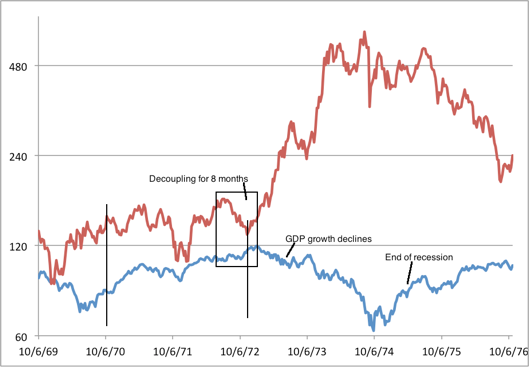 Previously we referred to the decoupling as two separate points but in reality, the decoupling began in 1972 and lasted into early 1978. The above chart shows how the BGMI surged right as the DOW entered a cyclical bear market. When the DOW bottomed, the BGMI peaked.
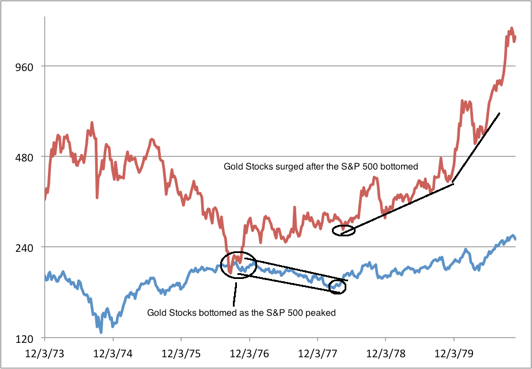
Note how the BGMI bottomed in late 1976, just as the DOW’s recovery petered out. The decoupling didn’t end until early 1978.
Today's Breakup
Although no one (to my knowledge) has publicly discussed the current decoupling, it is clear and obvious for all to see. This decoupling began at the end of July 2011. Since GDX peaked, it is down 32% while the S&P 500 is up 25%. (Silver is down 32% and Gold is down 14%). Also, the S&P is closing in a five-year high while GDX is soon to retest a multi year low.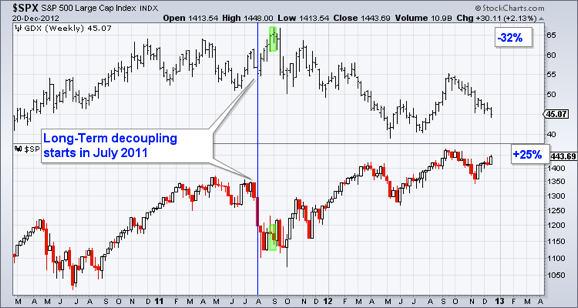
What's Ahead?
Going forward, we have the setup for an amazing contrarian opportunity. The trigger is an exacerbation in economic data and the general markets. As long as the markets are trending higher then Gold and gold stocks won’t get much of a bid. However, once markets lose momentum and the threat of increased policy becomes apparent, we will see precious metals confirm their bottom and resume their still fledgling cyclical bull. Now is the time to be vigilant but patient as these markets prepare to test their lows. Once these markets test their lows and flush out the weak bugs then that is the time to be a vulture. Speculators and investors are advised to carefully seek out the large or small companies which are poised for the best rebounds.
- English (UK)
- English (India)
- English (Canada)
- English (Australia)
- English (South Africa)
- English (Philippines)
- English (Nigeria)
- Deutsch
- Español (España)
- Español (México)
- Français
- Italiano
- Nederlands
- Português (Portugal)
- Polski
- Português (Brasil)
- Русский
- Türkçe
- العربية
- Ελληνικά
- Svenska
- Suomi
- עברית
- 日本語
- 한국어
- 简体中文
- 繁體中文
- Bahasa Indonesia
- Bahasa Melayu
- ไทย
- Tiếng Việt
- हिंदी
Precious Metals Decouple From Equities
Published 12/21/2012, 07:03 AM
Updated 07/09/2023, 06:31 AM
Precious Metals Decouple From Equities
Latest comments
Loading next article…
Install Our App
Risk Disclosure: Trading in financial instruments and/or cryptocurrencies involves high risks including the risk of losing some, or all, of your investment amount, and may not be suitable for all investors. Prices of cryptocurrencies are extremely volatile and may be affected by external factors such as financial, regulatory or political events. Trading on margin increases the financial risks.
Before deciding to trade in financial instrument or cryptocurrencies you should be fully informed of the risks and costs associated with trading the financial markets, carefully consider your investment objectives, level of experience, and risk appetite, and seek professional advice where needed.
Fusion Media would like to remind you that the data contained in this website is not necessarily real-time nor accurate. The data and prices on the website are not necessarily provided by any market or exchange, but may be provided by market makers, and so prices may not be accurate and may differ from the actual price at any given market, meaning prices are indicative and not appropriate for trading purposes. Fusion Media and any provider of the data contained in this website will not accept liability for any loss or damage as a result of your trading, or your reliance on the information contained within this website.
It is prohibited to use, store, reproduce, display, modify, transmit or distribute the data contained in this website without the explicit prior written permission of Fusion Media and/or the data provider. All intellectual property rights are reserved by the providers and/or the exchange providing the data contained in this website.
Fusion Media may be compensated by the advertisers that appear on the website, based on your interaction with the advertisements or advertisers.
© 2007-2024 - Fusion Media Limited. All Rights Reserved.