Several reports have been indicating that buyers of Gold and Silver (even more so the latter) have been of the strong long term variety. Such reports have focused on futures and ETFs, but the following May 14, 2014 Sharps Pixley report reflects that a combination of strong long-hand accumulation will have led to an explosive 2014, to kick off the next major legs of the precious metals' bull markets.
"Total physical silver demand rose by 13 percent in 2013 to an all-time high, according to World Silver Survey 2014, released today by the Silver Institute. This was primarily driven by the 76 percent increase in retail investment in bars and coins coupled with a sturdy recovery in jewelry and silverware fabrication. On the supply side, silver scrap fell by 24 percent, experiencing the largest drop on record to reach its lowest level since 2001. The silver price averaged $23.79 in 2013, the third highest nominal average price on record, in a particularly volatile year for the entire precious metals complex."
However, while I have been reporting on the long term super-leveraged lifetime opportunty in silver (see Precious Metals section), despite the numerable positives, I wish to now focus on my recent months' oft-repeated view that the next major buy point for silver would be the 6-month cycle low at the end of June. The technical picture is shaping up that way, and I want to look at that.
Before doing so, let me stress that nothing has changed.
In a recent report, we looked at the level of the CBOE Silver Etf Volatility (SLV volatility premiums) and, coupled with the underlying security's picture, as the above linkled article explained, even before the next cycle low it would be silly to not at least be 50% invested. Simply, be ready to take aggressive action relatively soon.
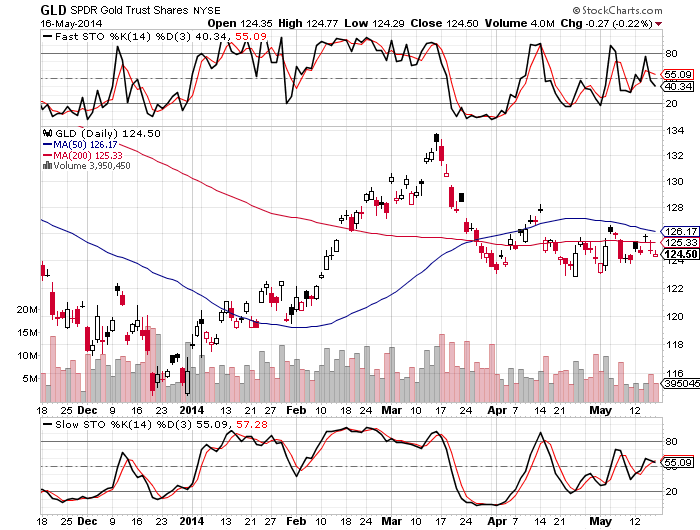
The single most important thing is that I see this year's GLD advance as being Wave-1, which means that an explosive secular bull market-resuming Wave-3 follows (6-month GLD chartbelow, includes the fast stochastic above the price chart, along with the more important slow one below it).
However, for those with short term timing on their minds, the Wave-2 low that I analyzed as having occurred in April now appears to have been a wave-a of 2 low, which would suggest that wave-b of 2 has just completed within a triangle, and that wave-c of 2 will now commence with a shot down to 120.
Please note the slow stochastic, which appears below the price chart. Also note the fast stochastic above the price chart, since it leads the slower and more reliable indicator.
I am concerned that the price pattern is typical of something that precedes an imminent decline, particularly since the momentum indicator's bounce has been relatively sharp relative to the price advance, suggesting that the bounce may run out of steam.
In other words, for so little positive price action, the slow stochatic has gone up too much relative to the corresponding price advance. This tends to be more typical of countertrend moves, in my experience.
Further, the stochastic is roling over and has plenty of room for decline, so as to leave ample opportunity for a drop down to ~$120. More importantly....

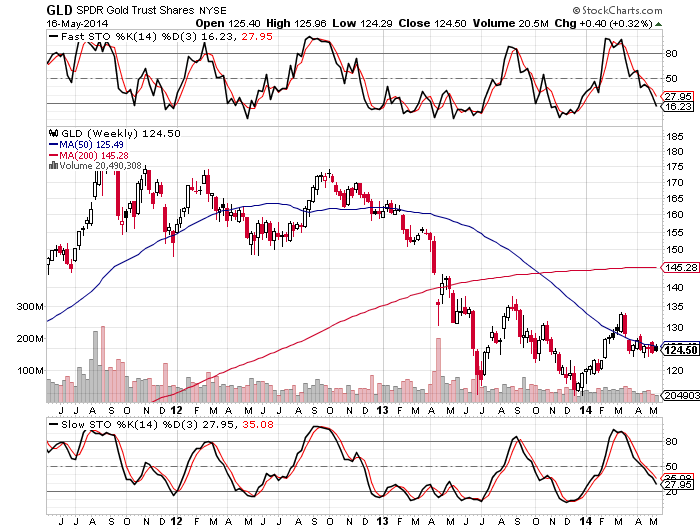
.....the 3-year weekly GLD chart alsoreflects a slow stochastic which has room to decline; its descent to below 20 (oversold reading) would time out perfectly for a low around June 30.
Then, we would also have the right shoulder of a reverse shoulder-head-shoulder pattern, and off we would go within a Wave-3 explosion, perhaps as Europe electronically prints. Meanwhile, the public could finally realize that much of its wealth is at risk to being "bailed-in", to the benefit of multi-national banks.
To understand the full picture, one must of course view gold's story in conjunction with silver's.

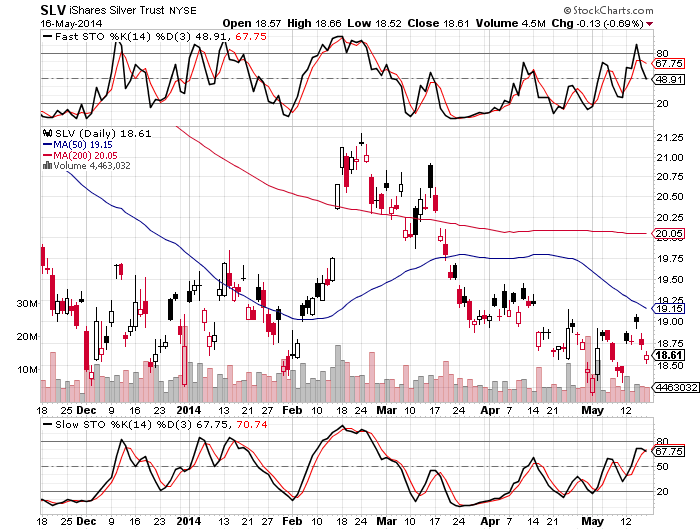
We can see from the 6-month daily SLV chart immediately below that its slow stochastic has rallied to an even loftier level than the corresponding GLD indicator, even as the SLV has barely budged. This is not good.
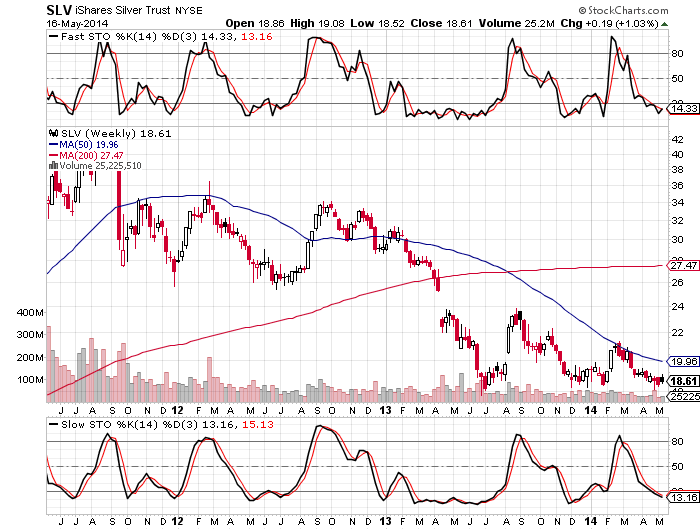
However, if the SLV can get over $19.50 and challenge $19.75, even without cracking $20, the SLV would then be reasonably well positioned to simply trade in a net-sideways fashion through to the end of the half-year cycle bottom. To better appreciate this, please consider the 3-year weekly SLV chart which follows the 6-month chart.


While the daily chart's slow stochastic has plenty of room for decline, the more important weekly indicator is already oversold. Whether the SLV makes a slight new low or not, its declining wedge pattern plainly illustrates two key points.
Firstly, there is a juicy reverse shoulder-head-shoulder pattern, just as there is in the GLD chart.
Simultaneously, and more subtly interesting, are the pattern's subdivisions; we are also witnessing this phenomenon with the Dow Jones.
Even though the type of patterns are different, the theme is the same in each case. Movements are being postponed, creating "coiled" patterns. This suggests that the subsequent advances (PMs) and declines (equities) will be thunderous.
While it would be easier to see on a 1-year daily SLV chart (not shown here), please do note the striking similarity between the pattern during the September - December 2013 period, with that of the period between February 2014 and the present.
Everything is subdividing into smaller and smaller degrees ("coiling"), until there are no (short) sellers left in the PMs, or buyers to be found to artificially support the Dow.
Investors are advised to invest what they can afford, in acquiring the recommended long term SLV calls, where the circumstances are the opposite of that which we find happening in the Dow.
The SLV is low, as are the premiums (note the VXSLV)! One can enjoy the benefit of time, as well as the double whammy of expanding time premiums, which will accompany the silver price's advance.
Therefore, while the situation is in reverse, the strategy is similarto the one expressed in the Dow article (also being published today). Above all, remember, silver can't be "bailed-in."
