
PRA Group Inc.’s (NASDAQ:PRAA) fourth-quarter 2017 earnings per share of 36 cents missed the Zacks Consensus Estimate of 37 cents by 2.7%. The bottom line, however, rose 9% from 33 cents in the year-ago quarter on higher revenues.
The company reported net income of $1.92 per share in the fourth quarter against net loss of 38 cents in the prior-year quarter.
PRA Group’s total revenues were $205.7 million, up 32% year over year. The top line also surpassed the Zacks Consensus Estimate by 5.1%.
The company’s fourth-quarter results were impacted by net after-tax benefit of $73.2 million due to the Tax Cuts and Jobs Act, pre-tax expense of $1.7 million from the impairment of a legacy PRA Group Europe passive investment and after-tax expense of $2.0 million related to redeemable non-controlling interest in a Polish securitization fund.
Full-Year Updates
The company reported net income of $3.54 per share for 2017, up 93% year over year.
PRA Group’s total revenues came in at $813.6 million in 2017, down 2% year over year.
Quarterly Operational Update
PRA Group’s net finance receivable revenues of $198.2 million soared 50% over the year-ago quarter owing to an outsized allowance charge in the previous-year quarter. Net finance receivable revenues also increased on the back of significant portfolio investment and yield increases on certain pools.
Fee income of $6 million plunged 71% primarily due to the sale of two fee-based subsidiaries earlier in the year.
Total operating expenses inched up 1.5% year over year to $150.5 million. This deterioration was largely due to higher expenses related to compensation and employee services plus other operating expenses.
In the quarter under review, the company reported cash collections of $376.3 million, up 8% from the prior-year quarter.
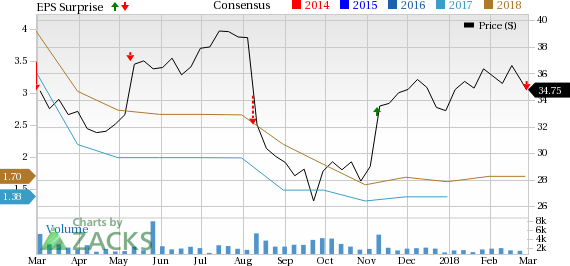
PRA Group, Inc. Price, Consensus and EPS Surprise
Financial Update
As of Dec 31, 2017, PRA Group had total assets worth $3.7 billion, up 17% from year-end 2016.
The company exited the quarter with total equity of $1.1 billion, up 24% from Dec 31, 2016.
As of Dec 31, 2017, cash and cash equivalents were $120.5 million, up 28% from year-end 2016.
In the reported quarter, borrowings increased 22% to $2.2 billion.
The company invested $374.6 million in new finance receivables in the fourth quarter, up 87% year over year.
Zacks Rank and Performance of Other Insurers
PRA Group has a Zacks Rank #3 (Hold). You can see the complete list of today’s Zacks #1 Rank (Strong Buy) stocks here.
Among other insurers that have reported fourth-quarter earnings so far, the bottom line of Brown & Brown, Inc. (NYSE:BRO) , MGIC Investment Corporation (NYSE:MTG) and The Progressive Corporation (NYSE:PGR) beat the respective Zacks Consensus Estimate.
Wall Street’s Next Amazon (NASDAQ:AMZN)
Zacks EVP Kevin Matras believes this familiar stock has only just begun its climb to become one of the greatest investments of all time. It’s a once-in-a-generation opportunity to invest in pure genius.
Click for details >>
Brown & Brown, Inc. (BRO): Free Stock Analysis Report
MGIC Investment Corporation (MTG): Free Stock Analysis Report
Progressive Corporation (The) (PGR): Free Stock Analysis Report
PRA Group, Inc. (PRAA): Free Stock Analysis Report
Original post