
Seems as though much has taken place in the first five months of this year that is newsworthy and impactful to the markets, i.e. Iran, North Korea, tariffs, an increasing 10-year yield, and I could go on. With the volume of news flow though, the equity market has essentially traded sideways this year with the S&P 500 Index price return equaling just 1.78%.

It seems with an equity market that has been pretty boring, some have focused on other issues, with one being a flattening yield curve. In the below chart, and I could go back further in time but suffice it to say that an inverted yield curve is not a positive signal, i.e., it is a recession predictor. As the below chart shows though, as the curve goes through the flattening process, stocks have been exceptionally strong performers. Recently though stocks have not been rewarded in spite of the continued flattening of the yield curve so far this year. Is the equity market spring being coiled?

Having noted the positive influence a flattening curve has on stocks, investors do not want to see the curve invert. In that regard there are two important economic events occurring that place upward pressure on the 10-year Treasury yield. First, inflation pressure is on the rise. The maroon line in the below chart shows the consumer price index (CPI or inflation) above the Fed's 2% target, i.e., rising at a 2.5% annual rate. The consumer segment accounts for approximately 70% of economic activity and if the consumer earns more in wages, they are likely to spend it; thus, having a positive influence on economic growth. In the same chart below, the blue line is the unemployment rate and it is at an extremely low 3.9%. This is an indication of a tight labor market and historically, this low level of unemployment has lead to higher inflation.

Secondly, the maroon line in the chart below shows a steady trend higher in the growth of average hourly earnings since 2013. The growth rate in wages is now running near the same level as inflation, i.e., 2.5%. Also notable on the chart below is the blue line that represents the percentage of small business firms (NFIB Survey) planning to raise compensation. In 2010 the percentage of firms indicating they were increasing compensation was essentially zero percent and today it is over 20%. Increasing growth in labor cost is fairly certain as one looks ahead, all else being equal.

In short, a tight labor market and upward growth in compensation are likely to translate into higher inflation. Higher inflation then places upward pressure on longer term interest rates, i.e., the 10 year Treasury. At a minimum a higher level of inflation may result in longer rates keeping pace with the Fed's push to move short term rates higher and thus keep the yield curve from inverting.
Finally, earnings growth for companies is an important variable in the growth of a company's stock price. As the below table shows, and with 96% of S&P 500 firms reporting Q1 2018 earnings, earnings growth in the quarter is a strong 26.3%

Tax relief has been an important element in this increase, but as the below chart also shows, top line revenue growth is nearing a double digit growth rate as well, i.e., Q1 revenue growth of 8.3%. 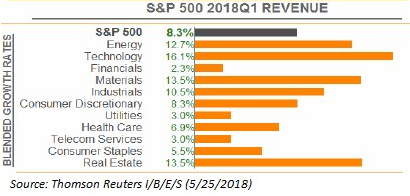
The Q1 2018 earnings and sales results are certainly positive; however, these are past results, the market is more interested in forward earnings growth. To this end, the below table shows forward growth estimates out through the fourth quarter of 2019. The red highlighted quarter represents the one year forward growth estimates for sales, net income and earnings in Q1 2019. The earnings growth for Q1 2019 is 6.9%, a significant slowing compared to Q1 2018 earnings growth of 26.3%. This slowing in the growth rate of future estimated earnings is likely contributing to the sideways equity market action experienced by investors during the first five months of this year.

The rapid move higher in stock prices in January was likely the market's excitement about the tax cuts and the positive impact on the near term Q1 earnings 'growth' rate. Realistic minds have prevailed and now the market is adjusting back to a more normal earnings growth rate environment, low double digits, hence the potential coiled spring market reference earlier.
I have noted in earlier blog articles (one here) the similarity of this bull market run to that of the 1950's and 1980's bull markets. If history rhymes, maybe the equity market is nearing a move higher. Charles Schwab (NYSE:SCHW) recently published a report, Buy in May…and Stay?, that provides further commentary on the market and economic environment for the balance of the year that readers may find of interest as well. 