
• Possible effects of monetary policy divergence in 2016 The Fed is expected to continue raising rates, while the ECB and many other central banks are likely to continue easing. In the absence of any shocks, we could see the dollar to strengthen against its counterparts, particularly versus those currencies whose central banks are expected to ease further, such as the euro and yen. As these currencies weaken, their economies’ exports will appear cheaper to US consumers and as such, they could enjoy a boost in demand. More importantly, those nations’ inflation rates might experience upward pressure through the increased prices of imported raw materials driving the general price level higher. On the other hand, some EM economies that have built up a lot of dollar-denominated debt may face capital outflows, as repaying their debts becomes increasingly more difficult. That could increase global financial volatility and perhaps have a spillover effect to the developed economies, as a result of reduced trade volumes. A possible EM weakness could even be a factor that slows down the US hiking path. Overall, the biggest beneficiaries of this divergence could be the nations that are still in a monetary easing mode, as they might see their economies gaining momentum through a weaker currency. The biggest hit could be taken by EM countries, facing higher interest rates on debt repayments.
• Today’s highlights: During the European day, we only get two indicators from the US. Initial jobless claims for the week ended on the 25th of December are expected to have increased to 270k, from 267k the previous week. The 4-week moving average is expected to remain virtually unchanged at 273k.
• The Chicago PMI for December is expected to increase and come very close to the crucial 50 line, but to remain below it. This indicator is highly correlated with the ISM manufacturing index. Therefore, a rise in the Chicago PMI is likely to increase the possibilities for a higher ISM index for December due to be out on Monday. However, the main question is whether these indices will rise enough to rebound back above 50 and indicate expansion.
• We have no speakers scheduled on Thursday’s agenda.
The Market
EUR/USD trades in a quiet manner

• EUR/USD traded quietly yesterday, staying near the 1.0915 (S1) support line. A clear move below that hurdle is likely to see scope for extensions towards the next support barrier of 1.0865 (S2), defined by the low of the 23rd of December. However, given that today is New Year’s Eve, market activity is expected to continue to be muted and the pair is likely to continue gyrating near 1.0915 (S1). Both our short-term oscillators, although within their bearish territories, stand near their equilibrium lines pointing relatively sideways. This confirms yesterday’s sideways action. Switching to the daily chart, I see that on the 7th and 17th of December, the rate rebounded from the 1.0800 (S3) key hurdle, which is also the lower bound of the range it had been trading from the last days of April until the 6th of November. As a result, I prefer to maintain a neutral stance as far as the overall outlook is concerned as well.
• Support: 1.0915 (S1), 1.0865 (S2), 1.0800 (S3)
• Resistance: 1.0985 (R1), 1.1050 (R2), 1.1100 (R3)
GBP/USD remains supported by the 1.4800 zone

• GBP/USD traded in a consolidative manner on Wednesday, staying between the 1.4800 (S1) key support zone and the resistance barrier of 1.4850 (R1). Although the short-term trend remains cautiously negative, bearing in mind our momentum studies, I believe that we are likely to experience an upside corrective move before the next negative leg. The RSI rebounded from near its 30 line and is now headed towards its 50 line, while the MACD has bottomed and could cross above its trigger line soon. What is more, there is positive divergence between both these indicators and the price action. A clear move above the 1.4850 (R1) line is likely to confirm the case of an upside correction and could initially aim for the 1.4900 (R2) line. In the bigger picture, the price structure remains lower peaks and lower troughs below the 80-day exponential moving average, which has turned down. Thus, I still see a negative longer-term picture and I would treat any possible recovery as a corrective phase for now.
• Support: 1.4800 (S1), 1.4700 (S2), 1.4600 (S3)
• Resistance: 1.4850 (R1), 1.4900 (R2), 1.4950 (R3)
USD/JPY hits resistance at 120.65

• USD/JPY traded slightly lower on Wednesday after it hit resistance at the 120.65 (R1) obstacle. The short-term outlook remains negative in my view and therefore I would expect the bears to regain their momentum at some point and perhaps target the psychological zone of 120.00 (S1). A dip below that zone is likely to extend the short-term downtrend and perhaps aim for the 119.60 (S2) support line. Our short-term oscillators detect negative momentum and support further declines, at least for a test at the 120.00 (S1) psychological zone. The RSI found resistance at its 50 line and turned down, while the MACD, already negative, shows signs of topping and could fall below its trigger line soon. As for the broader trend, the break below the 122.20 resistance zone, the lower boundary of the sideways range the pair had been trading since the 6th of November, has turned the medium-term picture to the downside in my view.
• Support: 120.00 (S1), 119.60 (S2), 119.25 (S3)
• Resistance: 120.65 (R1), 121.00 (R2), 121.30 (R3)
Gold falls below 1068

• Gold traded lower yesterday falling below the support (now turned into resistance) zone of 1068 (R1). The decline was stopped fractionally above our next support at 1058 (S1) and then the metal rebounded somewhat. Yesterday’s decline has turned the short-term bias back to the downside in my view and therefore, I would expect a clear break below 1058 (S1) to open the way for the key obstacle of 1046 (S2), defined by the lows of the 3rd and 17th of December. Taking a look at our short-term oscillators though, I see sings that the current rebound may continue for a while before the bears decide to pull the trigger again, perhaps to test the 1068 (R1) zone as a resistance this time. The RSI rebounded from slightly above its 30 line, while the MACD shows signs that it could start bottoming. As for the broader trend as long as the metal is trading between 1046 (S2) and 1090 (R3), I prefer to stay flat as far as the longer-term picture is concerned.
• Support: 1058 (S1), 1046 (S2), 1040 (S3)
• Resistance: 1068 (R1), 1080 (R2), 1090 (R3)
DAX falls back below 10800
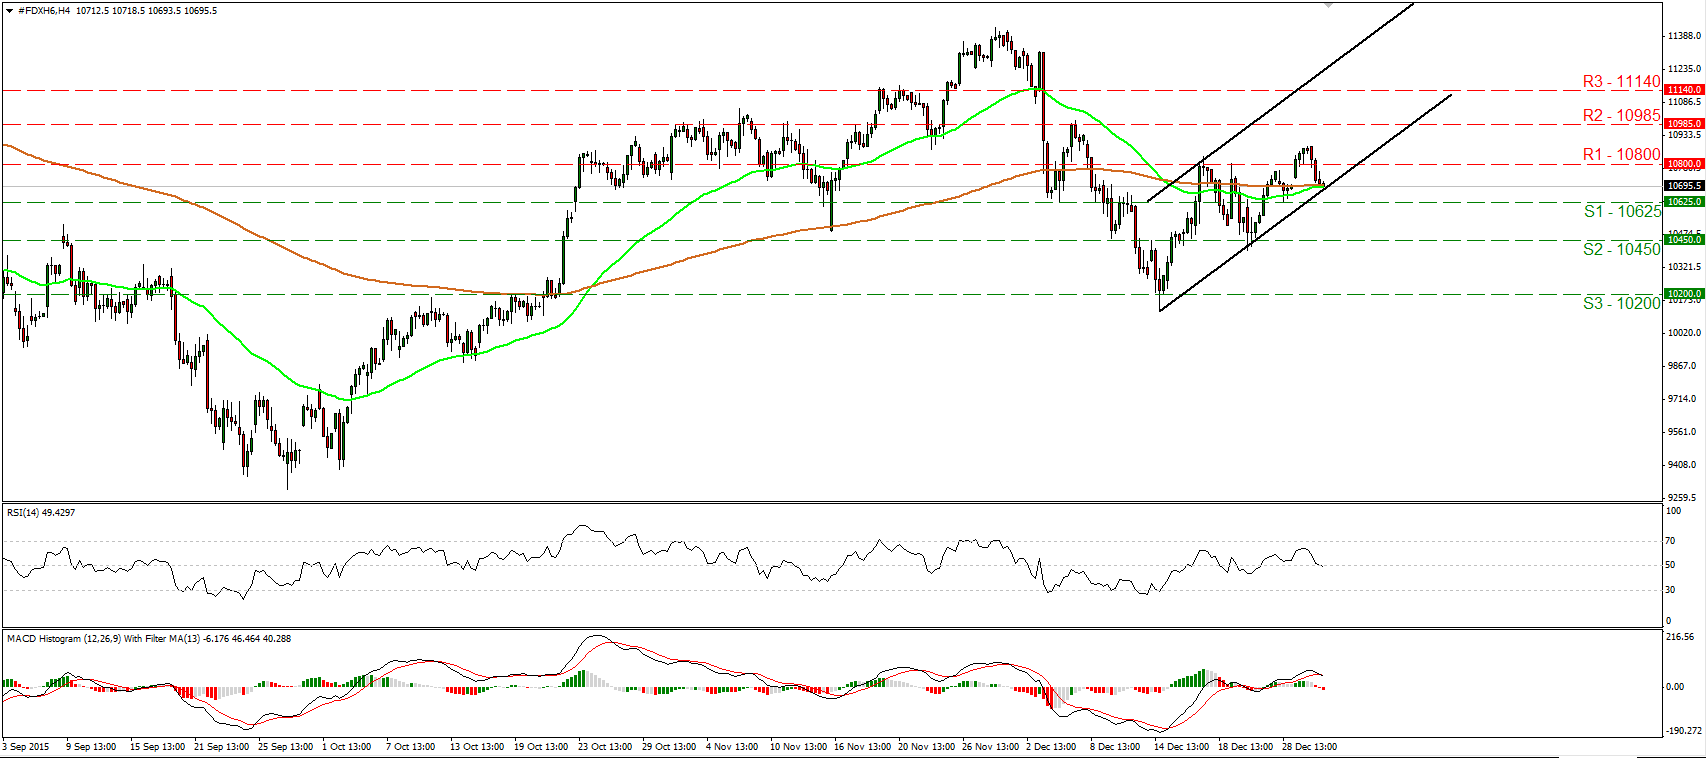
• DAX futures traded lower on Thursday, falling back below the 10800 (R1) barrier after it failed to reach the 10985 (R2) resistance line, marked by the peak of the 7th of December. The index is now trading near the lower bound of the upside channel that has been containing the price action since the 14th of December. I believe that a clear dip below 10625 (S1) is likely to signal the downside exit of that channel and could turn the short-term outlook to the downside. Such a break could initially aim for our next support zone of 10450 (S2). Our momentum studies reveal downside momentum and corroborate my view. The RSI just fell below its 50 line, while the MACD, although positive, has topped and fallen below its trigger line. As for the broader trend, the price structure on the daily chart points to a downtrend. However, I prefer to see a close below 10200 (S3) to trust larger negative extensions.
• Support: 10625 (S1), 10450 (S2), 10200 (S3)
• Resistance: 10800 (R1), 10985 (R2), 11140 (R3)
BENCHMARK CURRENCY RATES - DAILY GAINERS AND LOSERS

MARKETS SUMMARY
