The health of the consumer is one of the key drivers of the U.S. economy, given the preeminent importance of consumer demand (and of course, this is a feature of all developed economies, not just of the U.S.). Real personal income is the basic driver, which depends on both income growth and cooperative, quiescent inflation trends.
Consumers Have Reason To Cheer, And So Do Investors
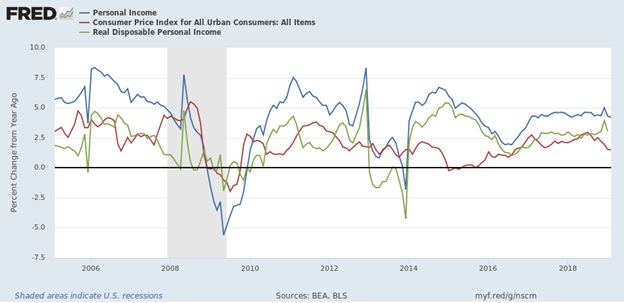
The Bureau of Economic Analysis (BEA) just published February data for personal income and inflation. Real disposable personal income rose at 3.0% year-on-year, about in line with the long-term average (3.2% since 1960), but above the nearer-term average (2.4% since 2013).

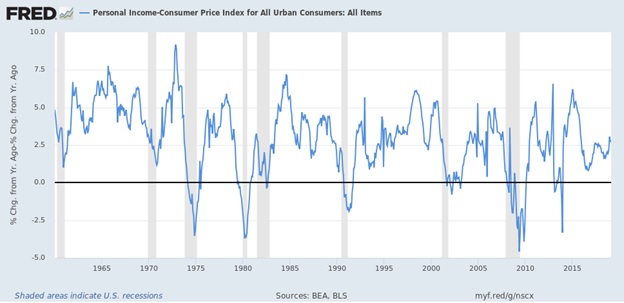
A sharp decline in personal income growth towards zero usually indicates an imminent recession (note the gray bars in the graph below, which are recession periods in the U.S. economy):

Although such a decline can occur rapidly before a recession’s onset, we note that current data do not suggest recession is imminent -- in spite of fears sparked by an inversion of one interest-rate yield curve on March 15.
Don’t Fear The Inversion (Yet)
Although we’ve been discussing the yield curve for some time, the concept has now become ubiquitous in financial media (we noticed it become a hot topic sometime last year). As usual, the way it is discussed is often misinformed and alarmist, since media (not just financial media) have an interest in causing fear to grab eyeballs.
Remember that the yield curve is the difference, or “spread,” between two interest rates -- one longer-term, and one shorter-term. Thus there are various “yield curves” that can be examined; the most common is the 2/10, that is, the difference between the two-year and 10-year U.S. Treasury bond interest rate. Others include the 6-month and 10-year, or the 3-year and 10-year. Some analysts (such as Canaccord Genuity’s Brian Reynolds, whom we respect) argue that it is more important to watch the spread between short- and long-term U.S. agency bonds (such as those issued by Ginnie Mae). We watch all of the spreads we have mentioned.
On March 15, the 3/10 curve inverted, prompting a flurry of news reports speculating breathlessly that in spite of the stock market’s strong performance year-to-date, the curve inversion signaled the imminent end of the post-2009 bull market. (The S&P 500 ignored the chatter and is up 2.5% since the inversion as of this writing.)
There are several Observations to make.
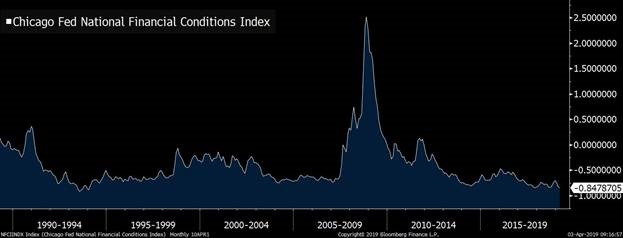
First, yield curve inversion has the effect that it does, because it signifies an approaching crunch in the availability of credit. Therefore, it’s important to evaluate yield curve activity in the context of credit stress, or the lack thereof. There is no visible credit stress in any of the more-than-100 metrics tracked by the Chicago Fed:
Overall U.S. Credit Stress Is At Cycle Lows
Lower Values Indicate Lower Credit Stress

Other data show the same: surveys of senior loan officers, corporate bond spreads, household debt servicing ratios, consumer delinquencies, etc. The data simply do not show the kind of credit stress that says a recession is around the corner.
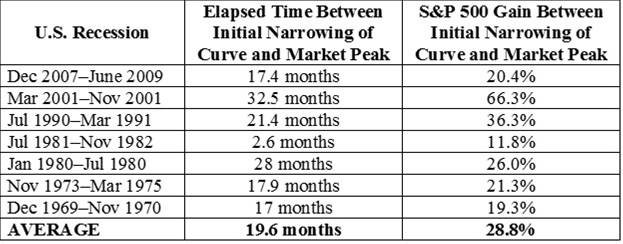
Second, yield curve inversion does not indicate that a bear market is upon us. On the contrary, the initial inversion of a significant yield curve typically indicates that a bull market is about to accelerate into its ultimate peak.
Last year, when we published our Recession Watcher’s Guide, we looked at past data, and saw that when the 6-month/10-year Treasury curve inverted, the market typically had more than 19 months to its peak, and gained almost 29% in that time:

Since the inversion of the 3/10 Treasury curve was very brief, and since other financial news have been positive, the fear has dissipated. Bouts of it will certainly come again -- perhaps when the 2-year and 10-year Treasury curve inverts. But when that fear arrives again, just remember: look at curve inversion in the context of other data, and expect that when the initial inversion has occurred, the market likely still has gains ahead before the peak.
Investment implications: The yield curve doesn’t function in a vacuum; it is connected to overall financial conditions, which remain very supportive. Also, the initial inversion of the curve typically indicates not the death of a bull market, but its acceleration into its final peak, often over a period of more than a year. Do not be dismayed by “yield curve” spin.
