
The Permanent Portfolio is an asset allocation concept first introduced by Harry Browne in 1982. The Permanent Portfolio Family of Funds website has this to say about the strategy, which they have been running in mutual fund format for about 20 years:
Established in 1982, in an era of stagnant economic growth and rampant inflation, Permanent Portfolio seeks to provide a sound structure and disciplined approach to asset allocation. The Fund was born in an environment where investors didn’t know where to turn. Regardless of what an investor did, they were losing money. Harry Browne, one of the founders of the fund stated, “It’s easy to think you know what the future holds, but the future invariably contradicts our expectations. Over and over again we are proven wrong when we bet too much on our expectations. Uncertainty is a fact of life.” No one can accurately predict the future.
[The] Permanent Portfolio recognizes this limitation and seeks to invest a fixed “Target Percentage” of its assets to six carefully chosen, diverse and “non-correlated” investment categories. Such diversification in a single mutual fund seeks to mitigate risk regardless of the economic climate. [Emphasis ours]
The Permanent Portfolio mutual fund purports to invest in six major asset classes according to the fixed prescribed weights in chart one, but the classes leave a lot of "wiggle room," so we performed a factor analysis to determine asset class exposures over the past three years (Chart two).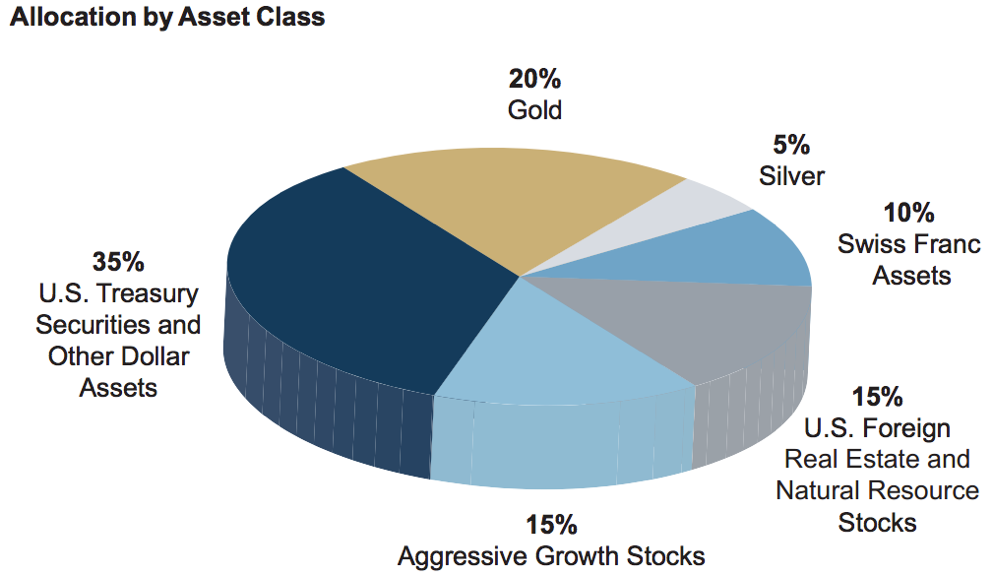
Source: Permanent Portfolio Family of Funds
The factor analysis below is the product of a multiple regression analysis whereby the daily performance of the Permanent Portfolio mutual fund is regressed on a basket of global risk factors. The factors in Chart 2. were statistically significant in explaining the performance of the portfolio over the past three years; non-significant factors were rejected.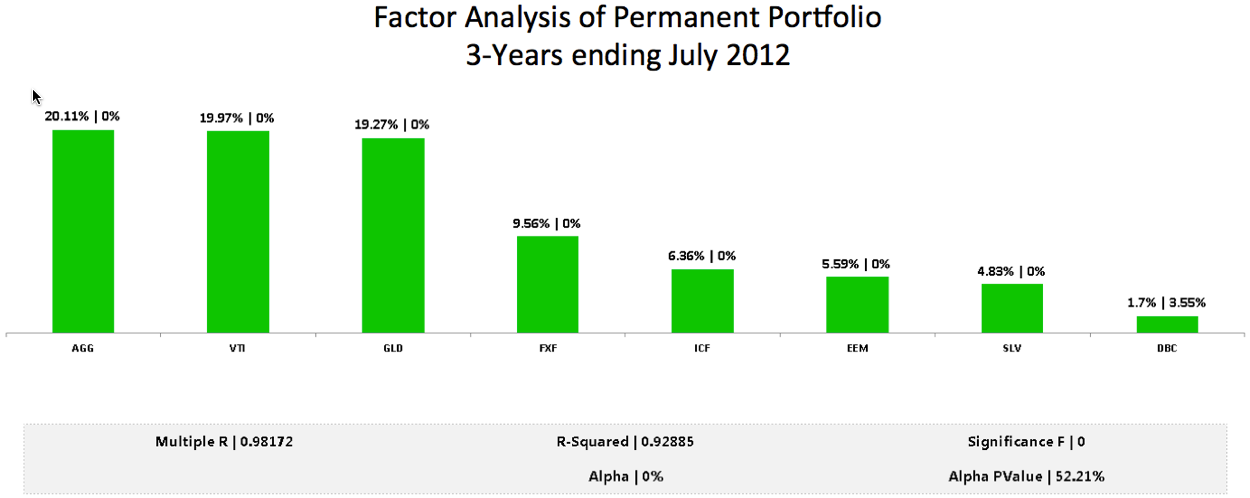
Source: Yahoo finance
Bonds, Stocks And Gold
You can see that the performance of the Permanent Portfolio can largely be attributed to high-grade U.S. bonds (AGG), U.S. stocks (VTI), and Gold (GLD) over the past three years, with each contributing about 20% to performance. All 8 factors together explain over 90% of portfolio returns for the period (see R-Squared = 0.92885).
On several occasions, Mr. Brown indicated that a simple equal allocation to stocks, gold, Treasuries, and T-bills would probably achieve the same goals as the more complex portfolio used in his mutual fund. Empirically, these four assets have worked very well together in portfolios for at least one reason: the long-term ex-post pair-wise correlations between the assets is essentially zero over the past 40 years, which means they offer superb long-term diversification potential.
A High Hurdle
Before we investigate the performance of the Permanent Portfolio, let's set the stage by taking a look at the performance of some more conventional approaches using daily total return data back to 1970. All multi-asset portfolios are rebalanced quarterly.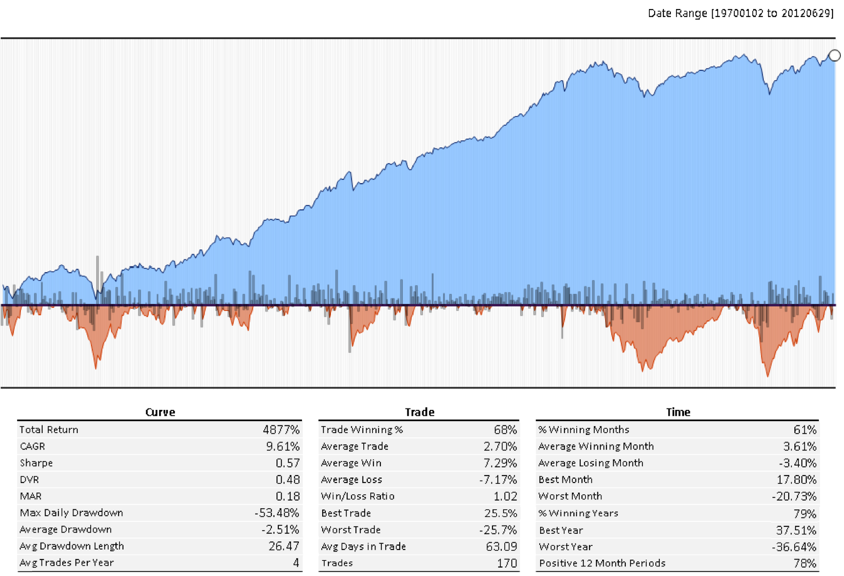
Source: Ken French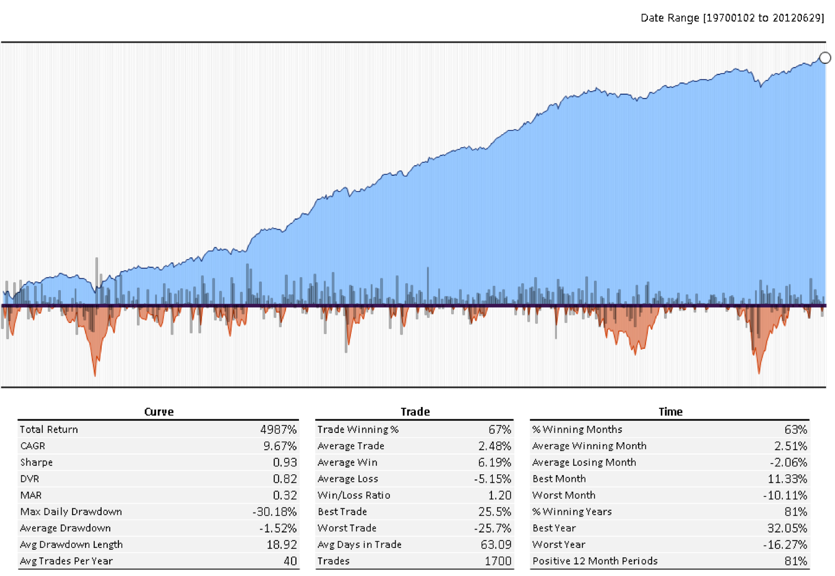
Source: Ken French, Shiller
The 60/40 Portfolio
Equities and the 60/40 portfolio have delivered essentially the same 9.6% total returns since 1970, (an astonishing blow to CAPM), but the 60/40 portfolio delivered its returns with almost 40% less volatility (10% vs. 17%) and drawdown (30% vs. 53%).
The Equal Weight Portfolio
Chart 5. Permanent Portfolio (Equal Weight stocks, gold, Treasuries, and cash), 1970 - 2012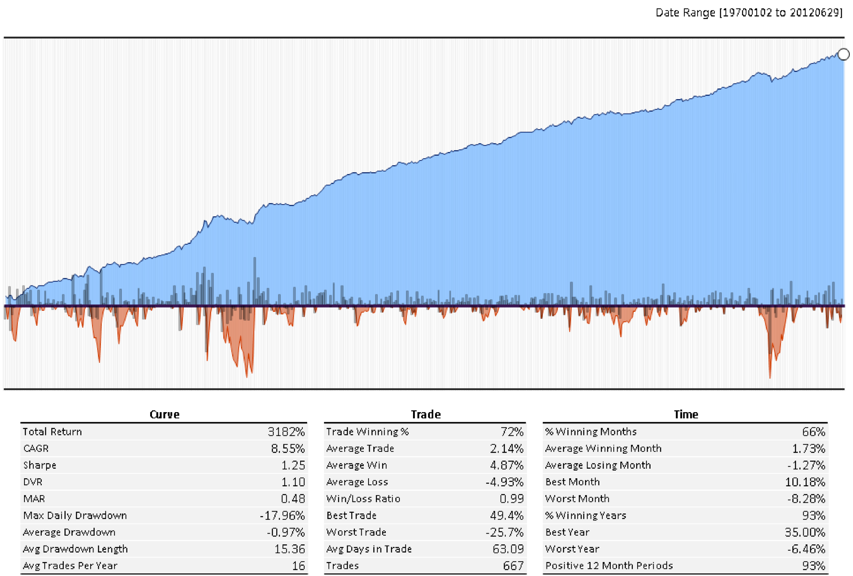
Source: Ken French, Shiller, CRB
The Permanent Portfolio provided returns of 8.55% per year over the same period, which is over 1% per year lower than either stocks or the 60/40 portfolio. However, because of the low correlations between the assets, this portfolio had substantially lower risk than 60/40. Ex-post volatility averaged less than 7% versus 10.4% for 60/40, and the maximum drawdown was reduced by almost half (18% vs. 30%)
Tough To Beat
The plain-vanilla version of this strategy is quite compelling on its own, and tough to beat. Unfortunately, the approach faces the same challenge as other static allocation approaches in the current environment: record low interest rates and expensive stocks and commodities, which suggests that returns to this approach may not be as strong over the next several years.
In Part 2 of this series we are going to explore some simple techniques that might further improve the performance of this approach, including volatility management, risk parity, moving averages and finally Adaptive Asset Allocation.
- English (UK)
- English (India)
- English (Canada)
- English (Australia)
- English (South Africa)
- English (Philippines)
- English (Nigeria)
- Deutsch
- Español (España)
- Español (México)
- Français
- Italiano
- Nederlands
- Português (Portugal)
- Polski
- Português (Brasil)
- Русский
- Türkçe
- العربية
- Ελληνικά
- Svenska
- Suomi
- עברית
- 日本語
- 한국어
- 简体中文
- 繁體中文
- Bahasa Indonesia
- Bahasa Melayu
- ไทย
- Tiếng Việt
- हिंदी
Permanent Portfolio Shakedown, Part 1
Published 08/21/2012, 12:00 PM
Updated 07/09/2023, 06:31 AM
Permanent Portfolio Shakedown, Part 1
3rd party Ad. Not an offer or recommendation by Investing.com. See disclosure here or
remove ads
.
Latest comments
Install Our App
Risk Disclosure: Trading in financial instruments and/or cryptocurrencies involves high risks including the risk of losing some, or all, of your investment amount, and may not be suitable for all investors. Prices of cryptocurrencies are extremely volatile and may be affected by external factors such as financial, regulatory or political events. Trading on margin increases the financial risks.
Before deciding to trade in financial instrument or cryptocurrencies you should be fully informed of the risks and costs associated with trading the financial markets, carefully consider your investment objectives, level of experience, and risk appetite, and seek professional advice where needed.
Fusion Media would like to remind you that the data contained in this website is not necessarily real-time nor accurate. The data and prices on the website are not necessarily provided by any market or exchange, but may be provided by market makers, and so prices may not be accurate and may differ from the actual price at any given market, meaning prices are indicative and not appropriate for trading purposes. Fusion Media and any provider of the data contained in this website will not accept liability for any loss or damage as a result of your trading, or your reliance on the information contained within this website.
It is prohibited to use, store, reproduce, display, modify, transmit or distribute the data contained in this website without the explicit prior written permission of Fusion Media and/or the data provider. All intellectual property rights are reserved by the providers and/or the exchange providing the data contained in this website.
Fusion Media may be compensated by the advertisers that appear on the website, based on your interaction with the advertisements or advertisers.
© 2007-2024 - Fusion Media Limited. All Rights Reserved.