


Sign up to create alerts for Instruments,
Economic Events and content by followed authors
Free Sign Up Already have an account? Sign In
Please try another search

The stock markets were suffering huge losses during the last month of 2018. The S&P 500 lost about 15% after its all-time high. The looming economic slowdown urges investors to look for safe places after 9 year-long economic expansion. Consumer staples sector became one of the most attractive havens for investors’ funds. According to Kensho, Consumer Staples sector performs the best when the S&P 500 losses more than 10%. Therefore, today we are going to explore two gigantic names from the sector.
We would compare Coca-Cola (NYSE:KO) with PepsiCo (NASDAQ:PEP) from many points to select the better stock from these two.
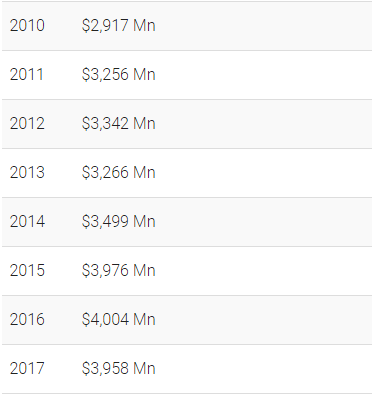
Goldman Sachs (NYSE:GS) recommended investors position their portfolio defensively as it sees 30% probability that the S&P 500 will continue downward movement during 2019. The firm recommends investors own “high quality” stocks. One of these stocks is PepsiCo. By the way, if we are looking at the overall institutional investors' sentiment, we notice that Institutions increased their stake in Pepsi during the last 4 consecutive quarters, but their sentiment on Cola was quite different. In Q3 2018 they sold $500 million more shares of Coca-Cola than they bought, in Q2 2018 difference was flat and in Q1 2018 the sellers sold more stock than the buyers bought. At the same time, Pepsi’s 72% of shares belong to institutions, while only 67% of Coca-Cola’s shares belong to institutions. Institutional Buying/Selling PepsiCo
Valuation
As the stocks perform in a mature industry, with no dramatic growth opportunities, we should emphasize the importance of stock valuation. From the first sight, we see P/E ratio of 31.8 on Pepsi’s stock and 72.62 on Cola’s case. The two numbers are rather exaggerated and can’t reflect high-quality stock in a volatile stock market environment. The main reason is the tax revision concerning two companies. In the case of Pepsi, the TCJ Act imposed a one-time transition tax on undistributed international earnings. As a result of the enactment of the TCJ Act, the company recognized a provisional net tax expense of $2.5 billion in the fourth quarter of 2017. So, EV/EBIT ratio would give a more precise understanding on the issue. Here we see that the Coca-Cola trades on 24.38, about 50% higher than PepsiCo's 16.32.
")
In the chart, we see that Pepsi's ratio is steadily moving down due to the increasing denominator, but Coca-Cola's ratio skyrocketed at the beginning of 2017. The main reason is decreasing sales, but the company is trying to offset the decrease by increasing EBIT margin.
")
The increase in margin was accomplished due to cutting SG&A spendings, which is not that good news. As we know the company used to heavily spend on advertisement to sustain its growth, but now it must decrease the marketing spendings. The trend has already broken because in the last 3 years the marketing spendings of the company was flattening.
")
EV/Revenue ratio of Coca-Cola is about 2.6 times higher than Pepsi's the same ratio, we see here that at the beginning of 2017 Coca-Cola's ratio began to increase, the main reason is decreasing revenue which is rather a disadvantageous fact, while the Pepsi's price increased in line with revenue growth.
 data")
Two companies return the biggest part of their earnings to their shareholders, and that fact attracts the majority of the investors. Pepsi has 46 years of consecutive dividend increases while the Coca-Cola increased the dividend during the last 56 years.
")
Trying to evaluate the stock using the Dividend Discount Model can be very appropriate because the companies perform in a mature industry with stable future prospects. The dividend payout ratio is 65% and 74% for Pepsi and Coca-Cola respectively.
But it would be more appropriate to calculate the Internal Rate of Return on current stock prices, which would give us an understanding of what market expects from the companies.
We will use the simplest DDM: Gordon-Growth Model which will tell us what rate expects the market for the dividend growth rate. Using US 2-Year T-Note Coupon Rate of 2.5%, as a risk-free rate and 5.21% for equity risk premium, with the 60-month rolling beta for the stocks, we conclude that the market expects Pepsi to increase its dividends 2.04% and Coca-Cola 1.89% indefinitely.
")
Exploring the chart above we can undeniably insist that Pepsi has more place to increase its dividends than Coca-Cola. They only pay 61% of their Cash Flow from Operations but the Coca-Cola pays about 96%. At the same time, Coca-Cola has experienced a revenue decrease in last years, and marketing spending decrease as well, which would cause a future decrease in sales.
At the same time, Pepsi was able to increase its sales and margins steadily, it was able to increase its dividend CAGR by 8.32% in the last 10 years. If we would assume the increase to continue on 2.5% indefinite CAGR, which is quite a controversial view, we would have $128 stock price which indicates about 16% undervaluation.

Takeaway
Comparing two great companies in the soft-drink beverages industry we could say that PepsiCo looks much more attractive than Coca-Cola. Relative valuation indicates that Coca-Cola trades at higher multiples than the Pepsi, while the Pepsi has much more reliable revenue generation history and more room to increase its dividends in mid-term to long-term horizon.
Before I put away the keyboard for the Holiday Season, I thought it might be a good idea to look ahead and see what the historical cycles have to say about the outlook for the...
Palantir Technologies Inc. continues to be a polarizing stock. Despite being up more than 155% in 2025, many investors remain concerned about the company’s...
It’s that time of year when Wall Street polishes up its crystal balls and begins predicting returns for 2026. Since Wall Street never predicts a down year, which would be...
Are you sure you want to block %USER_NAME%?
By doing so, you and %USER_NAME% will not be able to see any of each other's Investing.com's posts.
%USER_NAME% was successfully added to your Block List
Since you’ve just unblocked this person, you must wait 48 hours before renewing the block.
I feel that this comment is:
Thank You!
Your report has been sent to our moderators for review
Add a Comment
We encourage you to use comments to engage with other users, share your perspective and ask questions of authors and each other. However, in order to maintain the high level of discourse we’ve all come to value and expect, please keep the following criteria in mind:
Enrich the conversation, don’t trash it.
Stay focused and on track. Only post material that’s relevant to the topic being discussed.
Be respectful. Even negative opinions can be framed positively and diplomatically. Avoid profanity, slander or personal attacks directed at an author or another user. Racism, sexism and other forms of discrimination will not be tolerated.
Perpetrators of spam or abuse will be deleted from the site and prohibited from future registration at Investing.com’s discretion.