
Pattern Energy Group (NASDAQ:PEGI) reported a loss of 7 cents in second-quarter 2019 versus earnings of 34 cents per share in the year-ago quarter. The Zacks Consensus Estimate was pegged at earnings per share of 4 cents.
Total Revenues
Second-quarter revenues amounted to $140 million, which lagged the Zacks Consensus Estimate of $153 million by 8.5%. However, the total revenues were on par with the prior-year figure.
Quarterly Highlights
Pattern Energy sold 2,113,864 megawatt hours (MWh) of electricity on a proportional basis compared with 2,262,811 MWh in the year-ago quarter. The 7% decline was primarily caused by volume decreases attributed to divestitures in 2018 and unfavorable wind conditions.
Total operating expenses amounted to $15 million, reflecting a drop of 11.8% from the year-ago level.
The company incurred interest expenses of $25 million compared with $28 million in the year-ago quarter.
Pattern Energy Group Inc. Price, Consensus and EPS Surprise
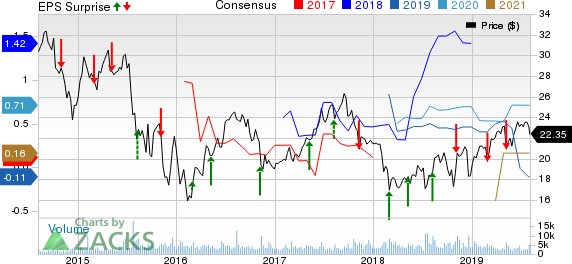
Pattern Energy Group Inc. price-consensus-eps-surprise-chart | Pattern Energy Group Inc. Quote
Financial Highlights
As of Jun 30, 2019, the company had cash and cash equivalents of $124 million compared with $101 million on Dec 31, 2018.
Its long-term debt was $2,084 million as of Jun 30, 2019, up from the Dec 31, 2018 level of $2,004 million.
The company’s cash flow from operating activities in the first half of 2019 was $75 million, down from $124 million recorded in the comparable year-ago quarter.
Guidance
Pattern Energy reaffirmed 2019 annual cash available for distribution in the range of $160-$190 million. The company also reaffirmed 2020 cash available for distribution in the band of $185-$225 million.
Zacks Rank
Currently, Pattern Energy has a Zacks Rank #5 (Strong Sell).
You can see the complete list of today’s Zacks #1 Rank (Strong Buy) stocks here.
Other Utility Releases
DTE Energy Company (NYSE:DTE) reported second-quarter 2019 operating earnings per share of 99 cents, which missed the Zacks Consensus Estimate of $1.09 by 9.2%.
Xcel Energy Inc. (NASDAQ:XEL) posted second-quarter 2019 operating earnings of 46 cents per share, which lagged the Zacks Consensus Estimate of 53 cents by 13.21%.
CMS Energy Corp. (NYSE:CMS) reported second-quarter 2019 adjusted EPS of 33 cents, which missed the Zacks Consensus Estimate of 44 cents by 25%.
The Hottest Tech Mega-Trend of All
Last year, it generated $8 billion in global revenues. By 2020, it's predicted to blast through the roof to $47 billion. Famed investor Mark Cuban says it will produce "the world's first trillionaires," but that should still leave plenty of money for regular investors who make the right trades early.
See Zacks' 3 Best Stocks to Play This Trend >>
DTE Energy Company (DTE): Free Stock Analysis Report
Xcel Energy Inc. (XEL): Free Stock Analysis Report
CMS Energy Corporation (CMS): Free Stock Analysis Report
Pattern Energy Group Inc. (PEGI): Free Stock Analysis Report
Original post
Zacks Investment Research