(Monday Market Open) Welcome to the last trading week of the decade.
The market is in the middle of the Santa Claus rally period – so-called because the last five trading days of the year and the first two of the new year are often kind to stocks.
This rally has been fueled by strong retail industry news, encouraging industrial profit numbers from China, and continued optimism about a U.S.-China trade deal getting signed next month and helping to ease worries about global economic growth and corporate performance that have dogged the market for the better part of two years.
What a difference a decade makes. We close out the 2010s with expectations of a trade deal, which has contributed to a string of market records. This is a marked difference in market performance versus the beginning of the decade, when stocks were still licking fresh wounds from the financial crisis. But one thing 2019 had in common with the early years of the outgoing decade—easier monetary policy. Though the Federal Reserve had started to wind down the zero interest rate policy and quantitative easing that helped fuel the rally in the decade’s early years, some feared the Fed was pumping the brakes a bit too hard by the end of 2018. A return to easy policy has helped stocks soar to new heights in 2019.
This morning, the market was looking at a flattish open for the main three U.S. indices. Yet Wall Street’s main fear index, the Cboe Volatility Index (VIX) was up more than 3% this morning and approaching 14. Saber rattling from North Korea could have something to do with the jitters, but it could also reflect some possible nervousness about the trade deal since it hasn’t actually been signed yet.
Or, the VIX could simply be reflecting a general note of caution as we head for the new year—as if the mid-month falloff in the VIX may have overshot the mark. Since December 10, the VIX traded as high as 16.9 and as low as 11.7. Since then, it’s been chopping higher, despite market gains.
Review And Look Ahead
The market ended mixed on Friday, with the Dow Jones Industrial Average (DJI) and S&P 500 Index (SPX) finishing with mild gains but the Nasdaq Composite (COMP) ending its winning streak. Still, all three of the main U.S. indices hit intraday record highs and the SPX and DJI managed record closes.
Last week saw thin trading volumes, as might be expected during a holiday week. Volumes might also be on the light side this week given that New Year’s Day falls midweek.
This week’s economic calendar is a bit heftier than last week, but there are still a couple of reports on the schedule that have historically had a high impact on the day’s trading.
On Tuesday, investors and traders are scheduled to get the Conference Board’s Consumer Confidence Index for December, and the ISM’s December manufacturing index is scheduled to come on Friday.
https://tickertapecdn.tdameritrade.com/assets/images/pages/md/rut-comp-12-30-19.jpg 800w" media="(min-width: 36em)" sizes="(min-width: 36em) 33.3vw, 100vw" />

https://tickertapecdn.tdameritrade.com/assets/images/pages/xs/rut-comp-12-30-19.jpg 2x" />
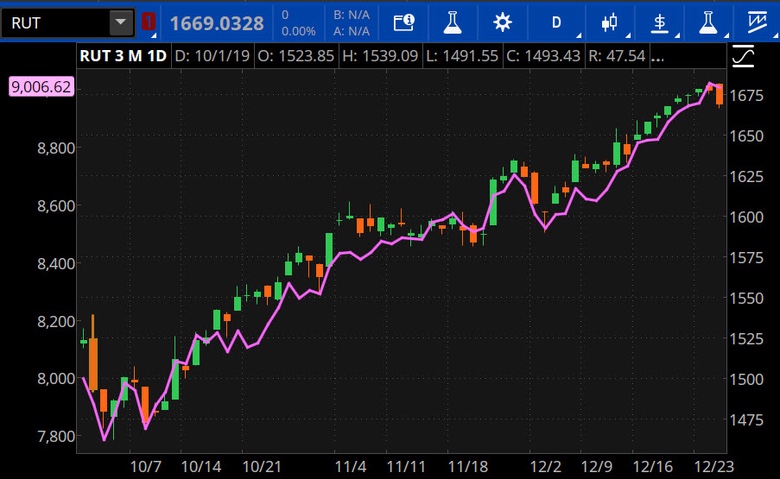
CHART OF THE DAY: SMALL CAP CHECK IN. Along with the Nasdaq Composite (COMP - purple line), the Russell 2000 Index (RUT - candlestick) also took a dip Friday. The RUT measures small-cap stocks and has generally been more insulated from trade-related angst than other indices that contain large multinational companies. Still, the RUT has been rising along with other indices—outpacing them at times—as the year comes to an end. Data sources: Nasdaq, FTSE Russell Indexes. Chart source: The thinkorswim® platform from TD Ameritrade. For illustrative purposes only. Past performance does not guarantee future results.
Consumers Confident: A Briefing.com consensus expects the Consumer Confidence Index to come in at 128 this week. That would be an increase from November’s 125.5 reading. Despite a decrease in the index last time around, the Conference Board noted that confidence levels were still high and should support solid holiday spending. That’s been borne out this holiday shopping season, with Mastercard (NYSE:MA) SpendingPulse data showing that U.S. retail sales excluding automobiles grew 3.4%, with online sales increasing 18.8%, year-over-year from Nov. 1 through Christmas Eve. Meanwhile, Amazon (NASDAQ:AMZN) announced a record-breaking holiday season in which customers ordered billions of items and purchased tens of millions of Amazon devices.
Manufacturing Slump Seen Continuing: The domestic manufacturing segment has been in a slump, with ISM readings showing contraction in manufacturing activity since August. For this week’s ISM manufacturing index, a Briefing.com consensus shows expectations for another contractionary reading. The expected reading of 49 would be an improvement over November’s figure of 48.1, but it still would show that the manufacturing sector hasn’t fully rebounded. Still, the services sector is much bigger in the United States, and ISM data for the non-manufacturing sector hasn’t been below 50 in years. That number marks the dividing line between expansion and contraction. The U.S. consumer has been helping keep the domestic economy afloat amid a strong jobs market and low interest rates.
Housing in Focus: One of the effects of low interest rates has been to help make homes more affordable. That in turn has helped boost demand for housing and lead to a short supply of affordable homes. Recent new and existing home sales data may have been hampered by a lack of supply. So it could be interesting to check out a S&P CoreLogic Case-Shiller home price index as well as a housing price index from the Federal Housing Finance Agency this week. Both data points are expected to come out Tuesday morning at 9:00 am ET.
TD Ameritrade® commentary for educational purposes only. Member SIPC. Options involve risks and are not suitable for all investors. Please read Characteristics and Risks of Standardized Options.
