As an internet radio company that receives mixed reviews at best, Pandora (P) is really not a social media company, but its chart is the lead with LinkedIn (LNKD) on all of the social media internet companies that recently went public, and thus is lumped into this category, incorrectly but hopefully helpfully, in this analysis.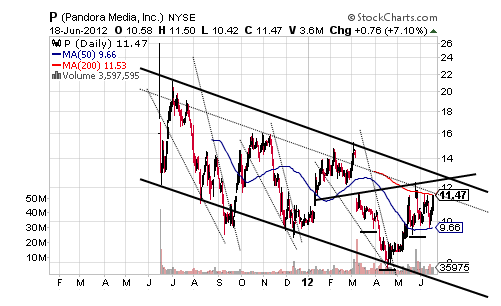
After closing its gap at $12.21, P has traded in a sideways manner that has probably wrangled the nerves of investors considering its very volatile trading over the last year as shown by a reliable Descending Trend Channel with P currently trying to trade above its newly established 200 DMA. And this is where the technicals become interesting on P with its Descending Trend Channel suggesting shares will slip back down toward its bottom near $7 while a possible Inverse Head and Shoulders pattern could break that bearish aspect to the upside to take P toward $16.
Reason to believe that P will choose the bullish IHS is shown by its confirmed Falling Wedge that carries a target of $15.25 and a good reason to think that P will bust above its Descending Trend Channel, but this should not be counted upon for the reason that its previous two Falling Wedges put in partial fulfillments only as is common with this pattern.
Relating P to some of the true social media companies that have gone public in recent months means connecting its tremendous volatility to the likes of Facebook (FB), Groupon (GRPN) and Zynga (ZNGA) in the form of its bullish Falling Wedges that fulfill in bearish Rising Wedges, and thus makes it a matter of determining where these stocks are relative to the Bull/Falling Wedges or Bear/Rising Wedges showing in the charts of each.
It is for this technical map that makes it worth lumping P in with the social media companies with its chart leading those names most likely along with direction provided by the chart of LNKD that, similar to P, shows a very volatile first year comprised of Falling and Rising Wedges.
And now turning to LNKD, it is fulfilling a bearish Rising Wedge with a target of about $60 and it appears to be doing so on a Head and Shoulders pattern that carries roughly the same target and a reason to believe this level will be hit.
However, should the H&S fail by a move above $120.63, LNKD could trade into a wildly bullish Ascending Triangle, but this seems unlikely now and the biggest message of LNKD’s chart to the charts of the younger public social media companies is the same as that of P and that is a message of extreme volatility made up of Bull/Falling Wedges or Bear/Rising Wedges. 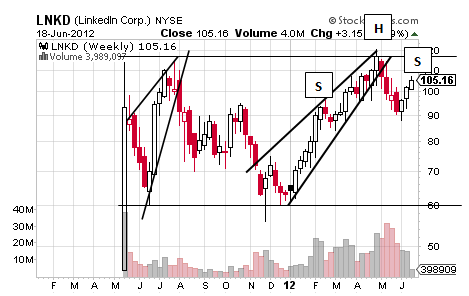
Let’s look at the charts of FB, GRPN and ZNGA under this technical roadmap, then, to see what the rest of 2012 might hold for social media as a sector with FB’s chart playing right into the highly volatile swings P and LNKD through none other than a Bull Wedge.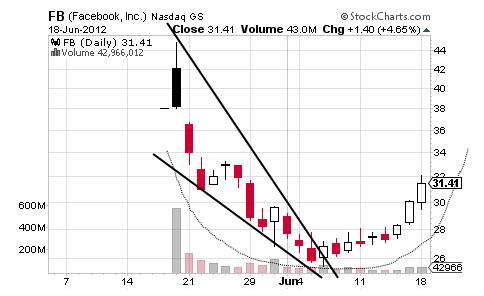
FB’s confirmed Bull Wedge carries a target of $45 and it is supported by a Rounding Bottom that confirms right above $33 for a target of $41 while both aspects are supported by a gap at $38 and a level that FB is likely to visit sooner rather than later.
So even if LKND starts to drop in the weeks ahead on its Rising Wedge, FB is in the fulfillment stage of its Bull Wedge with it seeming likely that it will trade back above $40 and probably in some sort of anticipation around the company’s Q2 earnings to be reported in July and this sort of move up would be completely consistent with P’s recent rise and LNKD’s big gains made earlier this year.
Turning to GRPN, its chart is very bullish as it fulfills a Bull Wedge through a Double Bottom with a much bigger Falling Wedge waiting in the background to take these shares up. 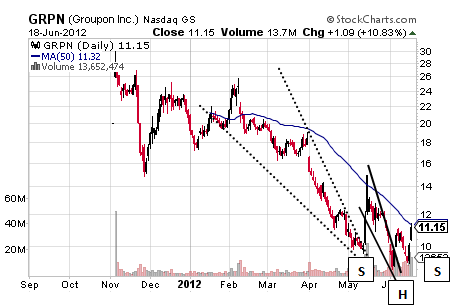
Rather than labeling a Double Bottom, though, it makes more sense to think of it as an Inverse Head and Shoulders pattern to come with a gap near $10.14 likely to close before the Bull Wedge will fulfill its target of $14.93 to confirm the IHS that carries a target of about $21.06 and a level that is below the $26 target of the Falling Wedge in dashes.
GRPN shares another similarity to the chart of P but one that is not marked above and that is the possibility that it is going to bust the top of a Descending Trend Channel with LNKD looking like the social media stock with the most to lose in the near-term, but let’s turn to ZNGA before finalizing that assessment, but alas, ZNGA looks like the real buy among the social media and recent internet IPO names. 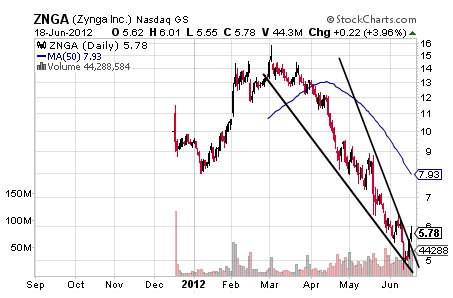
It looks like the real buy in this space on the very technical map laid out in P and that is a bullish Falling Wedge that confirms safely above $7 for a target of $16 with a small Inverse Head and Shoulders developing ahead of its July 23 earnings call that will confirm the bigger bullish pattern. Unless ZNGA breaches its all-time low and something that is unlikely due to a fierce weekly Spike Bottom, ZNGA looks ready to recover from the rough start out of its IPO gate.
Interestingly, then, the charts of FB, GRPN and ZNGA look bullish for at least the next quarter or so or until the bullish aspects showing in each chart fulfill to some large degree while the relatively more established recent internet IPO charts of P and LNKD provide a way to decipher that bullishness with P looking bullish itself and this leaves LNKD as the odd bear stock out on what could be a summer rally for this gamey space.
It seems worth lumping in P, then, with LNKD as a lead to FB, GRPN and ZNGA.
- English (UK)
- English (India)
- English (Canada)
- English (Australia)
- English (South Africa)
- English (Philippines)
- English (Nigeria)
- Deutsch
- Español (España)
- Español (México)
- Français
- Italiano
- Nederlands
- Português (Portugal)
- Polski
- Português (Brasil)
- Русский
- Türkçe
- العربية
- Ελληνικά
- Svenska
- Suomi
- עברית
- 日本語
- 한국어
- 简体中文
- 繁體中文
- Bahasa Indonesia
- Bahasa Melayu
- ไทย
- Tiếng Việt
- हिंदी
Pandora: Lumped In With LinkedIn And Leading Other Social Media Stocks
Published 06/20/2012, 12:13 AM
Updated 07/09/2023, 06:31 AM
Pandora: Lumped In With LinkedIn And Leading Other Social Media Stocks
3rd party Ad. Not an offer or recommendation by Investing.com. See disclosure here or
remove ads
.
Latest comments
Install Our App
Risk Disclosure: Trading in financial instruments and/or cryptocurrencies involves high risks including the risk of losing some, or all, of your investment amount, and may not be suitable for all investors. Prices of cryptocurrencies are extremely volatile and may be affected by external factors such as financial, regulatory or political events. Trading on margin increases the financial risks.
Before deciding to trade in financial instrument or cryptocurrencies you should be fully informed of the risks and costs associated with trading the financial markets, carefully consider your investment objectives, level of experience, and risk appetite, and seek professional advice where needed.
Fusion Media would like to remind you that the data contained in this website is not necessarily real-time nor accurate. The data and prices on the website are not necessarily provided by any market or exchange, but may be provided by market makers, and so prices may not be accurate and may differ from the actual price at any given market, meaning prices are indicative and not appropriate for trading purposes. Fusion Media and any provider of the data contained in this website will not accept liability for any loss or damage as a result of your trading, or your reliance on the information contained within this website.
It is prohibited to use, store, reproduce, display, modify, transmit or distribute the data contained in this website without the explicit prior written permission of Fusion Media and/or the data provider. All intellectual property rights are reserved by the providers and/or the exchange providing the data contained in this website.
Fusion Media may be compensated by the advertisers that appear on the website, based on your interaction with the advertisements or advertisers.
© 2007-2024 - Fusion Media Limited. All Rights Reserved.
