
The Yukon is the smallest of Canada's three 'federal territories', and, surprisingly, it relies on the tourism industry for revenue ... promoting itself as the "Larger Than Life" territory.
Of interest are the various 'vacation packages' available, headlined by a "Mushing Weekend Getaway", which includes a "Full Day Mushing Excursion", replete with dogs, and sled. Of course, like a rider urges a horse to "giddy-up", to put it in motion, dog-sled riders call out for the dogs to run, by using the phrase "mush".
Canadians across the country are calling for the economy ... to MUSH !!!!
Canadians everywhere are urging the Canadian stock market to ... MUSH !!!
Canadians are crying out for the commodities markets to ... MUSH !!!
We focus on last Wednesday's publication of the Bank of Canada's 1Q Monetary Policy Report, and the following text ...
... "The Bank's overall outlook for the Canadian economy is little changed from October. While there was more momentum than anticipated in the second half of 2011, the pace of growth going forward is expected to be more modest than previously envisaged."
And, as a result of the slowing economic momentum ...
... "Both total and core inflation are expected to moderate in 2012, before reaching 2 per cent by the third quarter of 2013."
Indeed, according to the December CPI data released on Friday, inflation could retrace more rapidly than the Bank of Canada is anticipating. Data scalpel in hand, we carve into the Canadian Consumer Price Index numbers, first by noting the DEFLATION revealed within the month-to-month changes:
CPI, All-Items ... down (-) 0.6%
CPI, Core ... down (-) 0.5%
CPI, Goods ... down (-) 1.1%
CPI, Services ... down (-) 0.1%
CPI, Household Operations ... down (-) 0.3%
CPI, Clothing ... down (-) 4.3%
CPI, Transportation ... down (-) 1.9%
CPI, Education ... down (-) 0.7%
Digging deeper, we note the accelerated slide in the year-over-year rates-of-change in various price indexes:
CPI, Food ... +4.4%, down from +4.8% in Nov
CPI, Clothing ... +0.3%, down from +1.1% in Nov, and +2.4% in Sept
CPI, Transportation ... +3.3%, down from +5.7% in Nov, and +7.9% in Sept
CPI, Education ... +0.2%, down from +0.5% in Nov, and +1.6% in July
CPI, Goods ... +2.4%, down from +3.4% in Nov, and +3.9% in Sept
CPI, Services ... +2.2%, unchanged from Nov, and down from +2.7% in Sept
Of interest is the decline in the year-over-year rate of inflation in the CPI excluding Food and Energy, which, in Canada, does NOT represent the 'core' rate. The year-over-year rate of change in Canada's CPI ex-Food and Energy fell to a lowly +1.3% in December ... down from +1.6% yr-yr in November, and down from +1.9% in September.
Further, we spotlight the chart below revealing the downward acceleration to a +2.3% yr-yr rate of headline CPI inflation, which represents a sizable single-month decline from November's +2.9% yr-yr rate, and the +3.2% rate posted in September. We also focus on the downside violation of the longer-term trend defining 2-Year Moving Average.
We note the path of the actual Consumer Price Index itself, seen in the chart below, wherein December's monthly deflation is clearly evident.
Digging deep, we extract the unique chart perspective offered below, as we focus on the degree of overt DEFLATION that Canada has experienced since the end of May, as defined by one of the largest EVER seven-month declines in the Consumer Price Index.
In fact, pegged at (-) 0.4 index points, the decline ranks fourth on the list of all-time bouts of deflation, behind only the deflationary waves experienced in Canada during 1994, 2000-01, and 2008-09.
Two weeks ago the Bank of Canada released the results of their end-December (4Q) Business Outlook Survey, wherein the Futures Sales Balance fell into overtly negative territory, pegged at minus (-) 4, down from +6 in the 3Q, and +20 in the 2Q. The Outlook has plummeted right back into the 'zone' that has, in the past, been associated with economic recession.
We note the steady erosion since the post-crisis spike to a high of +53 in the 3Q of 2009, and when we breakdown the data we can easily identify the loss of confidence via the following macro-mathematic 'sequence':
4Q 2011 .......................... (-) 4
First 3Q 2011 Average ......... + 13.0
All-2010 Average ............... + 30.0
Second Half 2009 Average ... + 51.5
In the chart on display below we observe the Bank of Canada's official Overnight Lending Rate, which is currently pegged at a still-lowly 1%.
We focus on the 'reaction' to the economic strength experienced in the second half of 2009, as seen in the previous chart (Business Sales Outlook), whereby Canada's Central Bank raised their official short-term policy rate three times during 2010, lifting it from its record low of 0.25%.
Yet, despite the rate hikes ... the 'real', or 'inflation-adjusted', official Overnight Lending Rate remains 'negative', as it has been for the last THREE YEARS, as evidenced in the chart on display below.
It is within this context, and armed with the knowledge that the downside for the nominal official short-term interest rate is 'limited' by eco-physics, that we begin to contemplate the next move by the Bank of Canada. From the Monetary Policy Report ...
... "With the target interest rate near historic lows, there is considerable monetary policy stimulus in Canada. The Bank will continue to monitor carefully economic and financial developments in the Canadian and global economies, together with the evolution of risks, and set monetary policy consistent with achieving the 2 per cent inflation target."
However, behind the scenes the Bank of Canada is continuing to nudge the macro-economic sled ...
... MUSH !!!!
Evidence the renewed expansion in the Canadian Central Bank's own Balance Sheet, as reflected within the chart shown below.
Indeed, in the last eight months the Total Assets held by the Bank of Canada has expanded by +9.0%, and in so doing the total has The chart below plots the year-over-year net change in the Total Assets held by the Bank of Canada, wherein we can see the transitions between periods where the Central Bank has accumulated assets, or liquidated them.
And, while the level of 'stimulus' is significantly less than was seen during the 2008-09 crisis period, clearly, amid the erosion in the underlying macro-economic scene, and in line with the more recent downside acceleration in the year-over-year rate of inflation, via December's over deflation ...
... the Bank of Canada is calling out more loudly ... MUSH !!!! In 'mushing' you have the "wheel dogs", the strongest pair of dogs on the team, providing an anchor, as might be represented by the Bank of Canada's short-term interest rate ... and, you have the "team dogs", in multiple-pairs, providing the horsepower that propels the sled. We might connect the pair of charts on display below, to the "team dogs" on the Bank of Canada's sled.
First we look at the 'real', or CPI inflation-adjusted, yield offered by the 30-Year Canadian Government Bond, as seen below in the long-term monthly chart covering the last twenty-two years. Clearly, the secular trend has been decidedly LOWER, with 'real' yields setting lower highs, and lower lows, for the last two decades.
Currently, the 'real' yield on Canada's THIRTY-YEAR paper is a mere 59bp !!! Could the 30-Year Bond yield drop below the year-year rate of inflation ???
We examine the chart below, spotlighting the price of the benchmark 'cash' 30-Year Canadian Government Bond (June of 2041) ...
... revealing a tenuous technical structure.
We focus on the topping-pattern and the move below underlying support, in synch with the downside violation of the short-term 50-Day Exponential Moving Average ... and ... bearish divergence by the intermediate-term MACD indicator, which is now tilted to the downside. Posing as the "swing dogs", the second pair from the front which initiate and are largely responsible for the turns in the sled ... are represented by global stock markets, including the Canadian S+P TSX Index.
Note the daily chart on display below, with a potential 'turn' to the upside taking place, at least on a med-term technical basis, perhaps in harmony with the collapse to near-record lows in 'real' long-term bond yields.
We focus on the violation of the med-term downtrend line, in place since last spring's bull move peak ... and ... the upside probe of the med-term trend defining 100-Day EXP-MA, following a 'text-book' Fibonacci retracement of the 2009-2011 bull move.
On a long-term basis, dating back to the beginning of the last decade (end-1999), the Canadian stock market has VASTLY outperformed the US market, as is clearly evidenced in the long-term daily overlay chart on display below in which we plot the percentage change in the benchmark Canadian (purple) and US S+P stock indexes.
Since the beginning of 2000, the Canadian S+P TSX index is up +52.6% ...
... while the US S+P 500 Index is DOWN (-) 6.2%.
Hence, we find the more recent relative performance between the Canadian S+P TSX Index (again, in purple) and the US S+P 500 Index (black) ...
... with the US market bidding to LEAD the way higher.
Indeed, we note the difference between the current relative performance, and that seen during the 2009-2011 bull move, when the Canadian stock market led the US to the upside, for months on end, riding the back of a reflation in commodity markets, Asian trade, and US demand.
We wonder ... if there is to be another wave of asset-price reflation, should not Canada be leading the way ???
If so, then is Canada currently 'undervalued', and a better relative 'play' ???
Then, IF (note the BIG 'if') asset-reflation is back in vogue over the med-term, then perhaps the US-based Canadian iShare is worthy of a 'look'.
We note the chart below, revealing the 'shallow' 38% Fibonacci retracement in the EWC, since the spring peak, which has given way to a 'buy signal' in the med-term Stochastic indicator, AND an upside violation of the med-term trend defining 100-Day Exponential Moving Average.
A move above $29.15 would complete a head-and-shoulders bottom, and provide technical confirmation of an upside 'turn' by this "swing dog". And finally, we have the two "lead dogs", the pair of dogs in the front of the team that is responsible for responding to the "musher's" commands, find and follow the trail, and set the pace for the entire team.
One of the "lead dogs" is the Canadian Dollar.
First, we note the high degree of positive correlation between the Canadian TSX Stock Index and the currency, as evidenced in the long-term weekly overlay chart on display below. We plot the Canadian Dollar (futures, versus USD, red line) against the S+P Canadian stock index (cash TSX, black bars). Telling is the tendency for the Canadian Dollar to 'lead' movements in the stock market, in both bullish, and bearish waves. The Canadian Dollar bottomed first in 2002, peaked first in 2007, bottomed first in 2008 ... and ... is now bidding to lead the stock market back to the upside. With that in mind, we focus on the Canadian Dollar itself, seen in the daily chart on display below. The Canuck Buck currently sits at a CRITICAL technical juncture, with the fate of the entire dog-sled hanging in the balance. A move above 99.45 would be bullish, generating an upside violation of the longer-term trend defining 200-Day EXP-MA, confirming the upside penetration of the downtrend line in place since last summer, and validating the fresh Stochastic 'buy signal'.
A move in the CAD above 99.45 would be 'supportive' to thoughts of a med-term appreciation in global asset-prices.
And the other "lead dog" is the commodity complex.
Note the high degree of positive correlation between the two "lead dogs", as evident in the long-term weekly overlay chart on display below in which we plot the Canadian Dollar (versus USD, blue bars) against the CRB Index of commodity prices (black line).
The two "lead dogs" are threatening to lead other markets higher. For that to happen ... the CRB must breakout, in tandem with a move in the Canadian Dollar through 99.45. Thus we note the long-term weekly chart below plotting the cash CRB Index, with focus on the potential for a completed 38% Fibonacci retracement relative to the entire 2009-2011 bull market move, via an A-B-C wave pattern. Further, we note the rapid price reversal, back to the upside, relative to the long-term 2-Year EXP-MA.
From here, the CRB Index needs to reclaim the ground above the 52-Week EXP-MA, which is last at 597.40 ... and ... the overhead resistance line connecting the one-time/all-time high set in 2008, and the mid-year-2011 lows/highs, pegged at 613.73, a move above which would constitute an upside technical breakout.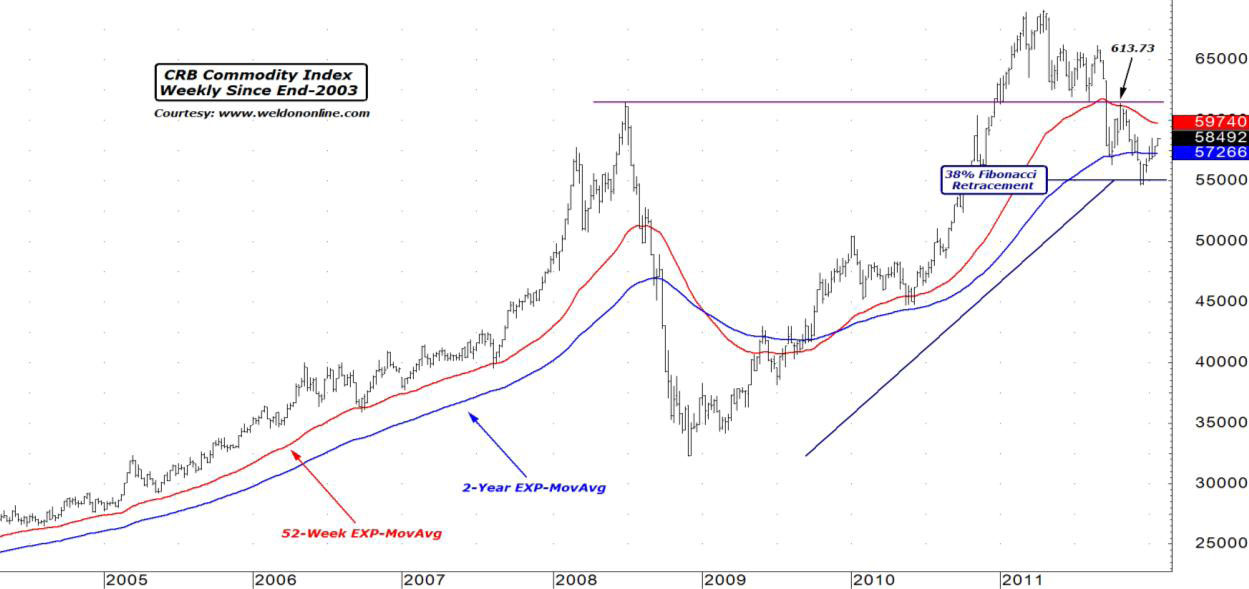 The "mushers" are lined up across the globe ...
... as Central Banks have become increasingly willing to call out those immortal words --- "MUSH" --- when it comes to monetary policy tilting back towards overt easiness, amid a downside reversal in inflation rates.
As was the case with our Money Monitor focus on Australia, when we look at Canada, we begin to feel more friendly towards the commodity complex, the commodity currencies, and even global stock indexes.
Of course, there is risk ... significant and substantial risk, linked to the FACT that the underlying, acute, major, macro-problems have NOT been fixed.
The EU debt-deficit debacle has NOT been 'fixed', it has merely been 'papered over', for now.
The US housing and labor markets have NOT been 'fixed', and are looking sideways, AT BEST, for the foreseeable future.
Japan ... is a powder-keg, waiting to explode.
BUT, as the old saying goes ...
... you cannot fight the Fed.
We might use the mutated version ...
... you cannot fight the MUSHERS !!!!
The call is out, the sled is moving, and we are becoming increasingly friendly towards select industrial commodities, particularly Copper, Palladium, and Gasoline ... as well as the commodity currencies, specifically the New Zealand, Australian, and Canadian Dollars.
- English (UK)
- English (India)
- English (Canada)
- English (Australia)
- English (South Africa)
- English (Philippines)
- English (Nigeria)
- Deutsch
- Español (España)
- Español (México)
- Français
- Italiano
- Nederlands
- Português (Portugal)
- Polski
- Português (Brasil)
- Русский
- Türkçe
- العربية
- Ελληνικά
- Svenska
- Suomi
- עברית
- 日本語
- 한국어
- 简体中文
- 繁體中文
- Bahasa Indonesia
- Bahasa Melayu
- ไทย
- Tiếng Việt
- हिंदी
Pace of Canadian Economic Growth Appears to Be Slowing
Published 01/26/2012, 05:07 AM
Updated 08/04/2023, 03:16 AM
Pace of Canadian Economic Growth Appears to Be Slowing
Latest comments
Loading next article…
Install Our App
Risk Disclosure: Trading in financial instruments and/or cryptocurrencies involves high risks including the risk of losing some, or all, of your investment amount, and may not be suitable for all investors. Prices of cryptocurrencies are extremely volatile and may be affected by external factors such as financial, regulatory or political events. Trading on margin increases the financial risks.
Before deciding to trade in financial instrument or cryptocurrencies you should be fully informed of the risks and costs associated with trading the financial markets, carefully consider your investment objectives, level of experience, and risk appetite, and seek professional advice where needed.
Fusion Media would like to remind you that the data contained in this website is not necessarily real-time nor accurate. The data and prices on the website are not necessarily provided by any market or exchange, but may be provided by market makers, and so prices may not be accurate and may differ from the actual price at any given market, meaning prices are indicative and not appropriate for trading purposes. Fusion Media and any provider of the data contained in this website will not accept liability for any loss or damage as a result of your trading, or your reliance on the information contained within this website.
It is prohibited to use, store, reproduce, display, modify, transmit or distribute the data contained in this website without the explicit prior written permission of Fusion Media and/or the data provider. All intellectual property rights are reserved by the providers and/or the exchange providing the data contained in this website.
Fusion Media may be compensated by the advertisers that appear on the website, based on your interaction with the advertisements or advertisers.
© 2007-2024 - Fusion Media Limited. All Rights Reserved.