: 67.2% (ending a 13-day overbought period)
VIX Status: 13.8
General (Short-term) Trading Call: SHORT with tight stop at new all-time highs on S&P 500
Commentary
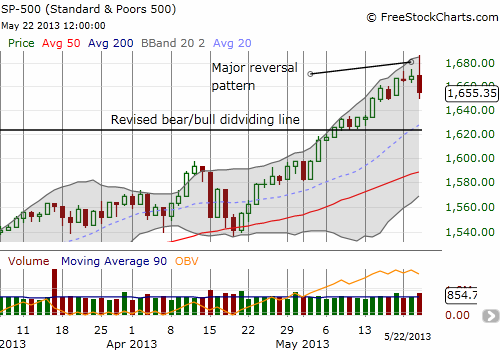
You aggressive bulls who bought the breakout above 1600 should seriously consider taking profits now. The burden of proof suddenly shifted back to the bulls as the S&P 500 printed a major reversal pattern. Follow-through selling tomorrow or Friday will confirm a topping pattern. I think overall the sell signals are strong enough to warrant getting into SSO puts starting tomorrow even though the index has not yet crossed the bear/bull dividing line (see below). Shorts should feel comfortable initiating positions with a tight stop at new all-time highs (intraday, not closing).
The pattern shown above is essentially a shooting star. The S&P 500 shot up to new all-time highs, only to reverse course and close below the previous day’s low. It found some support at the last (minor) consolidation point around 1650. Volume was higher than average, adding to the significance of this move. Note well that this topping pattern says nothing about how long shorts will get to make hay.
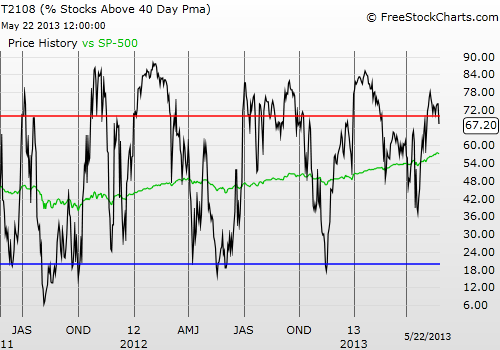
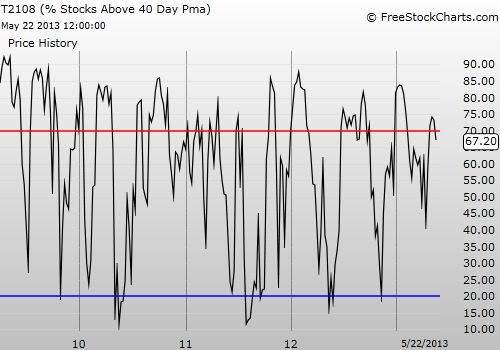
Today’s selling took T2108 out of overbought territory (the 70% overperiod). Overbought conditions lasted 13 days. The projection for the S&P 500 return over a 13-day overbought period is essentially flat. The S&P 500 printed a very bullish 2.5% return for the overbought period, placing it at the very top of the historical range. Now things get complicated.
The 70% underperiod is biased to the upside for the next 50 trading days. This makes sense. The market trend remains firmly up. If T2108 bounces back into overbought territory, the S&P 500 should follow along. This move would produce a positive return. So, this underperiod is not very interesting until around 50 trading days where the projections turns negative. So, let’s put that analysis aside for now and return to the primary messages from the 40% overperiod which began back on April 19th.
This is day number 24 of the 40% overperiod. The S&P 500 has returned a whopping 6.4% since then. This is coming at a time of maximum risk for the 40% overperiod. Historically, some of the worst performances of the S&P 500 have occurred just as a 40% overperiod ended around the 25-day mark. The average 40% overperiod lasts about 40 trading days (the median is 10 days), and the projection for the average overperiod is an essentially flat S&P 500 performance. Thus, a short on the S&P 500 here has an anticipated 6% return in three trading weeks. The shooting star gives a sense of a firm (short-term) cap on the index while this trade plays out (as well as providing a very clear, sensible, tight stop). Combined, all these characteristics provide excellent risk/reward and my confidence in finally loading up on SSO puts ahead of a violation of the bull/bear dividing line. If I had been watching near the close, I would have seen T2108 fall below 70%. I would have loaded up on SSO puts then.
A recent article tweeted by the CME called “Why QE, low interest rates and volatility are an explosive mix for the markets” also primed me to move as quickly as possible to a bearish stance. I had never thought of the implications of low interest rates quite this way before. Essentially, persistently low rates not only encourage investors and traders to take on too much risk and to misprice risk, but they also make investors and trades over-react to new information. The future has almost zero discount, so new information about a potential future can have a very immediate impact. it helps explain the market’s jitters with the whispers of “bond tapering” and hanging on every undertone and word from Federal Reserve Chair Ben Bernanke in his testimony to Congress today. (The release of the minutes from the last monetary policy meeting were icing on the cake for market jitters).
T2108 has given me plenty of reason for new bearishness. The recent behavior of very speculative stocks has provided bonus bearishness. As I pointed out in my T2108 Update from a week ago, it seemed to me highly shorted stocks were getting targeted as easy bait to goose prices high and fast. When this gambit works, it can certainly help traders (hedge funds?) who are underperforming the market catch up in a hurry. However, once the shorts stop covering (or the last one is finally flogged and beaten to death), the music stops and no one is likely left to keep buying these stocks at such lofty levels. Enter a correction. And what better time for a pullback than a topping pattern in the major indices. Even more interesting to have a top printed just as the performance of the most-shorted stocks on the S&P 500 outperform the index for the first time since July, 2012
Some of the stocks I noted has printed very notable topping patterns. Here is a list of the most convincing and why (the links take you to a close-up of the chart):
ANGI: Double-top. Bollinger squeeze suggest a big move is ahead.
APOL: Perfect resistance at the 200DMA confirmed with 4% picture-perfect rejection.
FSLR: Blow-off top. Accentuated by fade yesterday on high volume above the upper Bollinger Band.
GMCR: “Exhaustion” after six trading days failing to break through to a new 20-month high after numerous attempts.
NFLX: Confirmation of bearish engulfing pattern from last week at 21-month highs.
SCTY, SODA, and TSLA are down but not necessarily out yet from a technical perspective. Note well that the games may not yet be over, so trying to chase these lower could be fraught with risk. These stocks could easily move independently of the major indices if traders still sense they can squeeze more shorts into covering.
Herbalife (HLF) is in a special category of highly shorted stocks since I have written this one before and chose to stay long to ride what seemed like a tactical and strategic blunder by heavily short hedge fund manager Bill Ackman. It did happen, and I seemed to get out just near the peak of that run (I tweeted my trade). The stock has also printed a classic blow-off top. I will have to write a (final?) post on this experience because it took major patience and conviction.
Finally, currency signals continue to flash red. For example, the dollar index (UUP) has managed to continue pushing higher above its QE2 price.
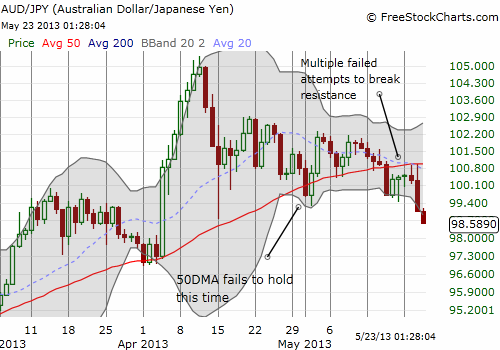
Perhaps more importantly, the Australian dollar continues to trade even weaker than the Japanese yen (AUD/JPY). The yen itself is finally looking it is ready for an old-fashioned counter-trend correction against all major currencies. I keep my eye on AUD/JPY because my original thesis of traders and investors fleeing from the yen to buy high-yielding currencies has simply not panned out. In fact, AUD/JPY PEAKED four days later. The Reserve Bank of Australia’s mystifying rate cut seems to have sealed the deal for now. AUD/JPY broke down below its 50DMA in what looks like the beginning of a sustained move given the multiple failures over the past week to break that resistance. I am compelled to be bearish if traders and investors are actually moving into zero-yielding yen over the relatively high-yielding Australian dollar, especially as the yen was still weakening against other major currencies. (Note that I have a small long position on AUD/JPY as a partial hedge on long yen positions and other short Aussie positions). 
(Late breaking update – after posting this piece, I learned that the Nikkei lost 7.3%!!! This is its largest loss in over two years – back to the tsunami. No wonder the yen is gaining so much strength right now. Looks like my entry for SSO puts will be from an uncomfortably lower point. Perhaps the S&P 500 even gaps below the bull/bear dividing line at the open on Thursday!)
Black line: T2108 (measured on the right); Green line: S&P 500 (for comparative purposes)
Red line: T2108 Overbought (70%); Blue line: T2108 Oversold (20%)
Be careful out there!
Full disclosure: net short Australian dollar, net long Japanese yen, long TSLA call (NEW call – last week’s trade was quite successful!), net long U.S. dollar,
- English (UK)
- English (India)
- English (Canada)
- English (Australia)
- English (South Africa)
- English (Philippines)
- English (Nigeria)
- Deutsch
- Español (España)
- Español (México)
- Français
- Italiano
- Nederlands
- Português (Portugal)
- Polski
- Português (Brasil)
- Русский
- Türkçe
- العربية
- Ελληνικά
- Svenska
- Suomi
- עברית
- 日本語
- 한국어
- 简体中文
- 繁體中文
- Bahasa Indonesia
- Bahasa Melayu
- ไทย
- Tiếng Việt
- हिंदी
Overbought Period Ends With Blow-Off Tops And Sell Signals
Published 05/23/2013, 08:49 AM
Updated 07/09/2023, 06:31 AM
Overbought Period Ends With Blow-Off Tops And Sell Signals
T2108 Status
3rd party Ad. Not an offer or recommendation by Investing.com. See disclosure here or
remove ads
.
Latest comments
Install Our App
Risk Disclosure: Trading in financial instruments and/or cryptocurrencies involves high risks including the risk of losing some, or all, of your investment amount, and may not be suitable for all investors. Prices of cryptocurrencies are extremely volatile and may be affected by external factors such as financial, regulatory or political events. Trading on margin increases the financial risks.
Before deciding to trade in financial instrument or cryptocurrencies you should be fully informed of the risks and costs associated with trading the financial markets, carefully consider your investment objectives, level of experience, and risk appetite, and seek professional advice where needed.
Fusion Media would like to remind you that the data contained in this website is not necessarily real-time nor accurate. The data and prices on the website are not necessarily provided by any market or exchange, but may be provided by market makers, and so prices may not be accurate and may differ from the actual price at any given market, meaning prices are indicative and not appropriate for trading purposes. Fusion Media and any provider of the data contained in this website will not accept liability for any loss or damage as a result of your trading, or your reliance on the information contained within this website.
It is prohibited to use, store, reproduce, display, modify, transmit or distribute the data contained in this website without the explicit prior written permission of Fusion Media and/or the data provider. All intellectual property rights are reserved by the providers and/or the exchange providing the data contained in this website.
Fusion Media may be compensated by the advertisers that appear on the website, based on your interaction with the advertisements or advertisers.
© 2007-2024 - Fusion Media Limited. All Rights Reserved.
