
We updated our research report on O’Reilly Automotive, Inc. (NASDAQ:ORLY) on Aug 21.
O’Reilly is a Springfield, MO-based specialty retailer of automotive aftermarket parts, tools, supplies, equipment and accessories in the U.S. The company sells products to both Do-it-Yourself (DIY) customers and Do-it-for-Me (DIFM) or professional installers.
In second-quarter 2017, the company reported adjusted earnings of $3.10 per share, beating the Zacks Consensus Estimate of $2.90. Quarterly revenues rose 5% to $2.29 billion from $2.18 billion a year ago. Revenues were almost on par with the Zacks Consensus Estimate. However, the company cut its outlook for 2017.
For the third quarter of 2017, O’Reilly projects earnings per share in the range of $3.10-$3.20. The company expects consolidated comparable store sales to increase 1-3%. For full-year 2017, the company expects earnings per share in the band of $11.77-$11.87 compared with the previous expectation of $12.05-$12.15. O’Reilly projects consolidated comparable store sales increase in the range of 1-2% during the year. The company anticipates revenues in the band of $8.9-$9.1 billion compared with the previous expectation of $9.1-$9.3 billion. For 2017, the gross margin guidance is in the range of 52.5-52.9% and operating margin is expected to be 19.1-19.5% compared with the previous estimate of 20.1-20.5%.
Also, O’Reilly’s stores are concentrated in a few locations in the United States. A large number of stores are located in Texas and California. Therefore, its business is sensitive to the economic and weather conditions of these regions. Inclement weather discourages customers, particularly DIY customers, from visiting stores. This has, in the past, affected sales to a considerable extent.
In the last 30 days, the company’s third-quarter earnings per share estimates moved down. Shares of O’Reilly have underperformed the industry in the last year. While the stock declined 30.7%, the industry lost 28%.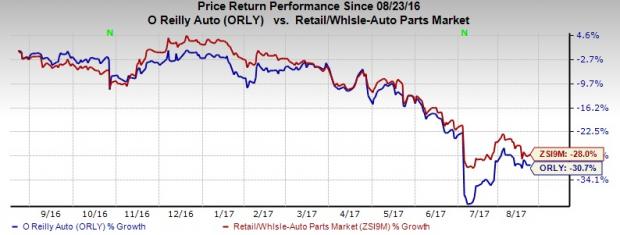
Currently, O’Reilly carries a Zacks Rank #4 (Sell).
A few better-ranked automobile stocks are Ferrari N.V. (NYSE:RACE) , PACCAR Inc (NASDAQ:PCAR) and Cummins Inc. (NYSE:CMI) . While Ferrari N.V. sports a Zacks Rank #1 (Strong Buy), PACCAR and Cummins carry a Zacks Rank #2 (Buy). You can see the complete list of today’s Zacks #1 Rank stocks here.
Ferrari has an expected earnings growth rate of 14.1% in the long run.
PACCAR has a long-term growth rate of 10%.
Cummins has an expected long-term earnings growth rate of 12%.
Zacks' 10-Minute Stock-Picking Secret
Since 1988, the Zacks system has more than doubled the S&P 500 with an average gain of +25% per year. With compounding, rebalancing, and exclusive of fees, it can turn thousands into millions of dollars.
But here's something even more remarkable: You can master this proven system without going to a single class or seminar. And then you can apply it to your portfolio in as little as 10 minutes a month.
PACCAR Inc. (PCAR): Free Stock Analysis Report
O'Reilly Automotive, Inc. (ORLY): Free Stock Analysis Report
Ferrari N.V. (RACE): Free Stock Analysis Report
Cummins Inc. (CMI): Free Stock Analysis Report
Original post
Zacks Investment Research