Due to Oracle’s (ORCL) very cyclical quarterly results, the year over year (YoY) results are the way of keeping score. The score is mixed from this latest quarterly report.
The GAAP earnings per share of $0.41 was an encouraging +13.89% YoY, compared to +11.29% YoY last quarter, which was a 9-quarter low. The downtrend was reversed. The problem is the GAAP EPS outlook for next QE November 2012 of $0.45 to $0.49 or +4.65% YoY to +13.95% YoY. The downtrend will either redevelop or Oracle treads water in a best case scenario. However, the Fed’s quantitative easing might just save the day when earnings are reported in December on a weaker US Dollar.
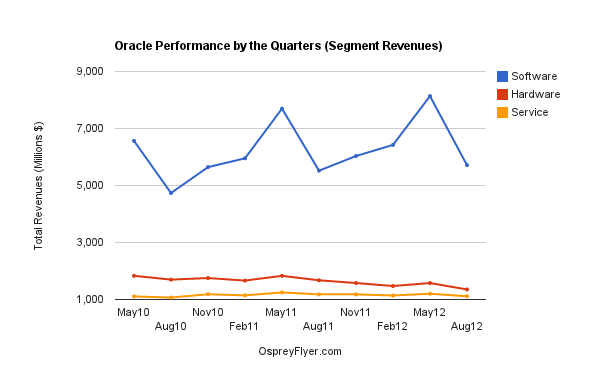
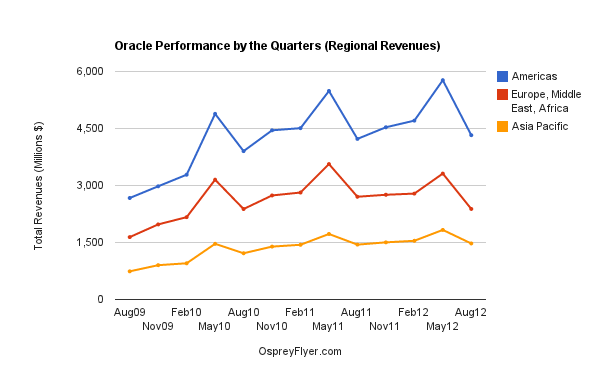
Total revenues were a disappointment, down -2.30% YoY and projected for QE November 2012 at +0% to +5% QoQ.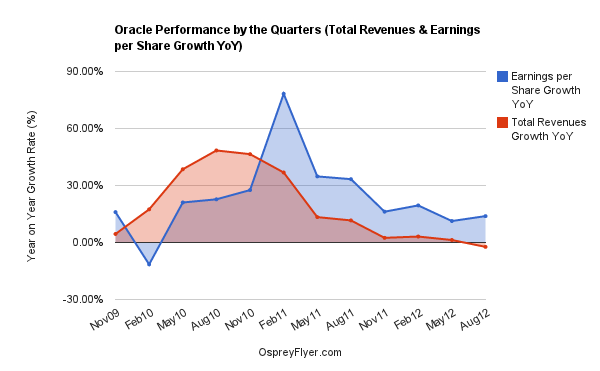
Strengthening US Dollar: Oracle should benefit next quarter from the Federal Reserve’s infinite quantitative easing. For the QE August 2012, “Without the impact of the US dollar strengthening compared to foreign currencies, Oracle’s reported Q1 GAAP earnings per share would have been $0.03 higher at $0.44, up 24%, and Q1 non-GAAP earnings per share would have been $0.03 higher at $0.56, up 17%. Both GAAP and non-GAAP total revenues also would have been up 3%, GAAP new software licenses and cloud software subscriptions revenues would have been up 10%, non-GAAP new software licenses and cloud software subscriptions revenues would have been up 11% and both GAAP and non-GAAP hardware systems products revenues would have been down 21%.”
The long-term trend is clearly upwards as evidenced by the GAAP EPS chart below. However, the strength of the uptrend is weakening. The biggest performance concern is the flat to decreasing YoY growth rates in total revenues and perhaps a resumption of slowing YoY growth rates in earnings per share.
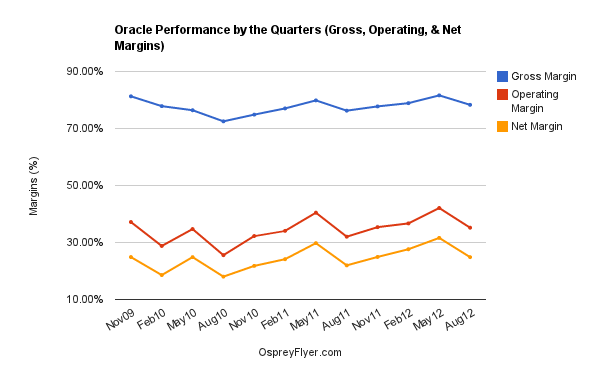
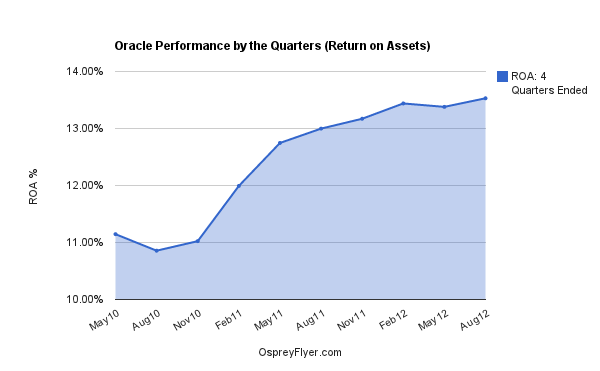
The biggest financial position negative has been the debt. This is now 19% of total assets and at a multi-year low, down from a peak of 26% for the QE August 2010. Financial position continues acceptable with adequate capital, moderate debt, strong liquidity, and an increasing return on assets. Stock repurchasing and dividends are a plus.
GAAP Quarterly Financial Result, QoQ Change, YoY Change
Total Assets: $76.56 billion, -2%, +4%
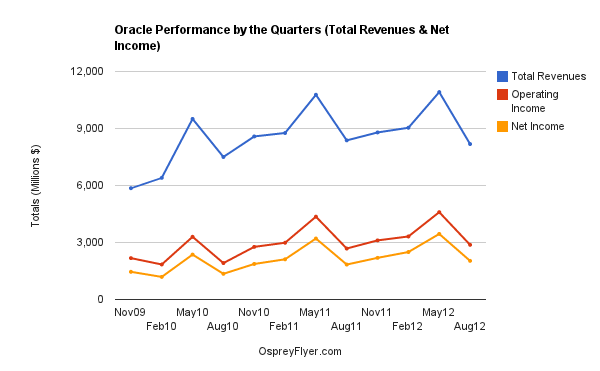
Revenues: $8.18 billion, -25%, -2%
Net Income: $2.03 billion, -41%, +11%
Earnings per Share: $0.41, -41%, +14%
Cash Flow per Share $1.15
1-Year Return on Assets +13.53%
Oracle Outlook QE November 2012
GAAP and Non-GAAP Total Revenues +0% to +4% QoQ
Non-GAAP EPS of $0.59 to $0.63 = $0.61 avg = +15% QoQ, +13% YoY
GAAP EPS $0.45 to $0.49 = $0.47 avg = +15% QoQ, +9% YoY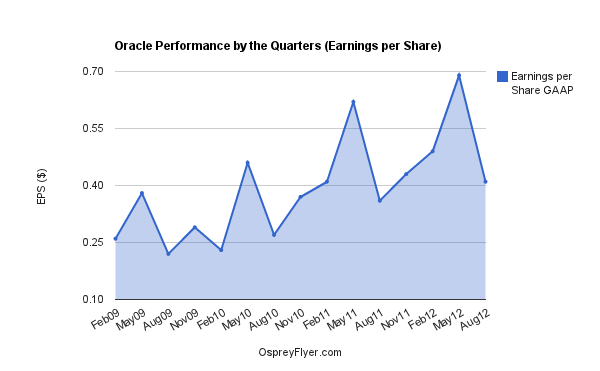
Oracle Cloud: “A little more than a week from now we will announce lots of enhancements to the Oracle Cloud,” said Oracle CEO, Larry Ellison. “There are more CRM, ERP and HCM applications as a service, and more Oracle database, Java and social network platform services. Our new infrastructure as a service is available in the Oracle Cloud and as a private cloud in our customers’ data center, with the nique ability to move applications and services back and forth between the two. Join us at Oracle OpenWorld for all the details.”
- English (UK)
- English (India)
- English (Canada)
- English (Australia)
- English (South Africa)
- English (Philippines)
- English (Nigeria)
- Deutsch
- Español (España)
- Español (México)
- Français
- Italiano
- Nederlands
- Português (Portugal)
- Polski
- Português (Brasil)
- Русский
- Türkçe
- العربية
- Ελληνικά
- Svenska
- Suomi
- עברית
- 日本語
- 한국어
- 简体中文
- 繁體中文
- Bahasa Indonesia
- Bahasa Melayu
- ไทย
- Tiếng Việt
- हिंदी
Oracle Earnings Review: EPS Strengthens, Revenues Weaken, Outlook Stable
Published 09/21/2012, 04:22 AM
Updated 07/09/2023, 06:31 AM
Oracle Earnings Review: EPS Strengthens, Revenues Weaken, Outlook Stable
Latest comments
Loading next article…
Install Our App
Risk Disclosure: Trading in financial instruments and/or cryptocurrencies involves high risks including the risk of losing some, or all, of your investment amount, and may not be suitable for all investors. Prices of cryptocurrencies are extremely volatile and may be affected by external factors such as financial, regulatory or political events. Trading on margin increases the financial risks.
Before deciding to trade in financial instrument or cryptocurrencies you should be fully informed of the risks and costs associated with trading the financial markets, carefully consider your investment objectives, level of experience, and risk appetite, and seek professional advice where needed.
Fusion Media would like to remind you that the data contained in this website is not necessarily real-time nor accurate. The data and prices on the website are not necessarily provided by any market or exchange, but may be provided by market makers, and so prices may not be accurate and may differ from the actual price at any given market, meaning prices are indicative and not appropriate for trading purposes. Fusion Media and any provider of the data contained in this website will not accept liability for any loss or damage as a result of your trading, or your reliance on the information contained within this website.
It is prohibited to use, store, reproduce, display, modify, transmit or distribute the data contained in this website without the explicit prior written permission of Fusion Media and/or the data provider. All intellectual property rights are reserved by the providers and/or the exchange providing the data contained in this website.
Fusion Media may be compensated by the advertisers that appear on the website, based on your interaction with the advertisements or advertisers.
© 2007-2024 - Fusion Media Limited. All Rights Reserved.
