As seems often the case, it is the bad news that leads headlines and garners the attention of those interested in digesting news reports. In the current economic environment though it seems somewhat difficult to promote the bad news when there seems little of it. I am not saying there is no bad news, but much of the news today that is related to the market and the economy is decidedly positive, however, from my perspective this good news does not seem to get much press. So, below are highlights of some of the positive news that may be of interest to investors.
The Consumer:
The consumer segment accounts for 70% of economic growth and post the financial crisis in 2009, the consumer seems in very good shape.
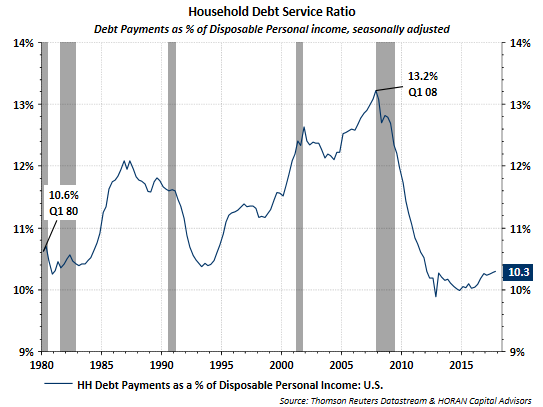
- debt payments as a percentage of disposable personal income is lower than the pre-financial crisis level and below the level at the beginning of 1980.
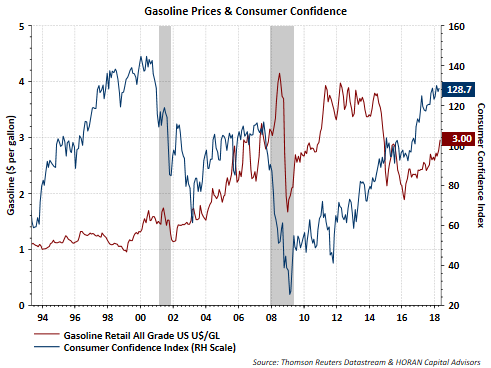
- One media focus of 'bad' news is the current increase in gasoline prices. As the below chart shows, gasoline prices and consumer confidence rose together from 2002 up until 2008, a six year rise in the price at the pump. From 2014 to the beginning of 2016 the per gallon price of gasoline fell from $3.50 per gallon to under $2.00 per gallon and consumer confidence fell. What is occurring is gasoline prices in and of themselves do not have a large negative influence on the consumer. Higher gasoline prices tend to be a consequence of a stronger economy and the consumer benefits more from a strong economy versus simply looking at the 'potential' drag of higher gasoline prices.
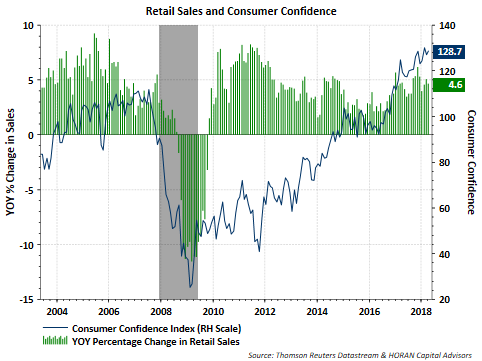
- One area that benefits due to the strength in consumer confidence is retail sales. Could retail sales be higher? Sure. But as the below chart shows, the rate of retail sales growth has been increasing since 2016. Higher gasoline prices do not seem to have detracted too much from consumer spending in other areas.
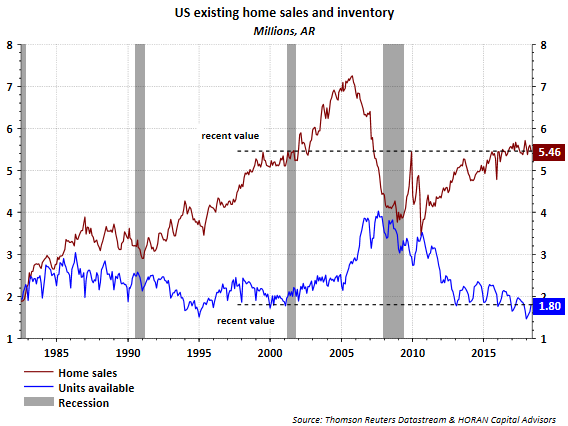
- With respect to home sales, reports continue to highlight the fact sales are below the level reach before the financial crisis. From my perspective this is good. Many of those pre-financial crisis home sales should have never occurred. The current level of home sales is the same level reached before the recession that occurred following the bursting of the technology bubble in 2000.
Businesses:
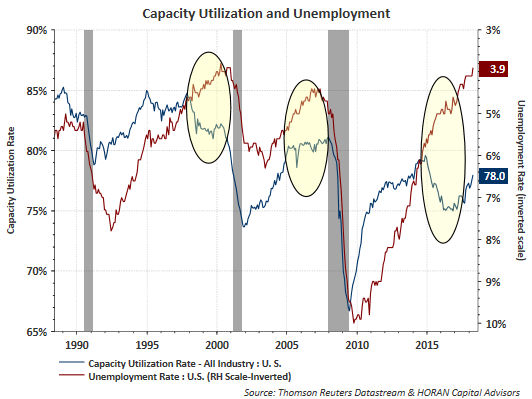
- At the beginning of 2016 I started to have concern about the decline in the capacity utilization rate. Some of the weakness at that time was associated with the high level in the per barrel price of oil, over $100, and the headwinds from a strong US dollar. Partly due to the tax cut at the end of 2017 and the overall strength of the global economy, manufacturing has picked up along with an increase in capacity utilization since the beginning of 2017.
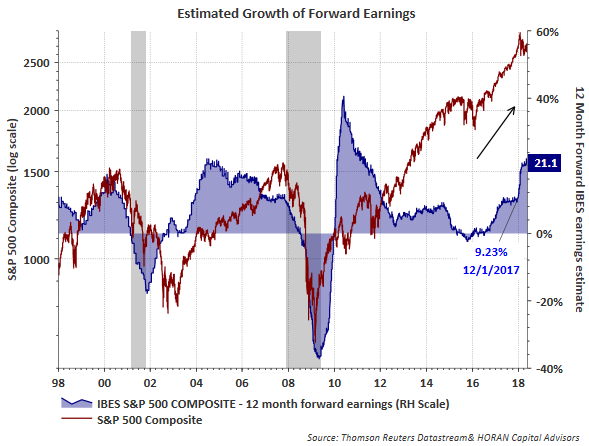
- I published a post yesterday, Potential For A Stronger Second Half In Stocks, that contained a broader look at earnings. However, below is a snapshot showing I/B/E/S 12-month forward earnings growth expectations for the S&P 500 Index. At the beginning of December 2017, earnings growth expectations equaled 9.2%. Today expectations are for 12-month earnings growth to equal 21.1%. This is not a sign of a weakening corporate sector.
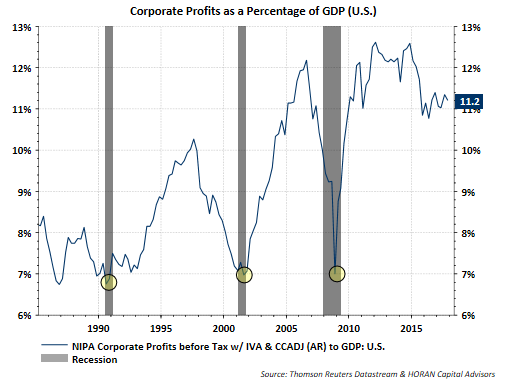
- The above earnings figure represents S&P 500 companies. A broader profit measure is included in the calculation of GDP, this National Income and Product Account (NIPA) profit figure is also at a high level. The below chart shows profits at 11.2% of GDP and far above levels seen prior to a recession.
The Economy:
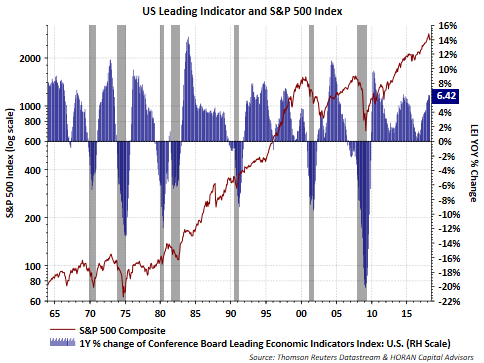
- Again, economic weakness was beginning to be seen in the 2015/2016 time period. The below chart shows the downward trend in industrial production and the Conference Board's Leading Economic Indicator (LEI). The LEI came close to going negative; however, reversed to the upside mid year 2016. Currently, both the LEI and Industrial Production are moving higher and not moving in a direction that would indicate a recession is on the near term horizon.
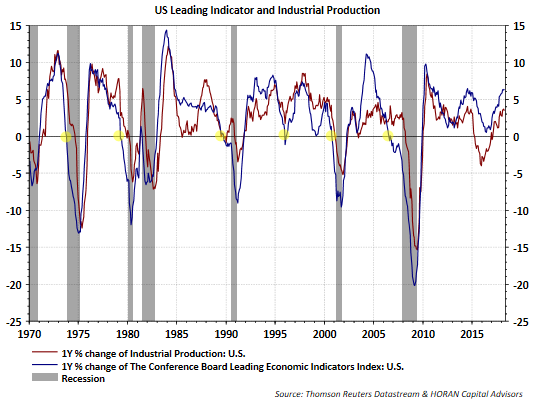
- The positive and increasing trend in the year over year change in the LEI is associated with a positive equity market. Historically, the LEI turns negative prior to a recession and prior to a significant decline in equity prices.
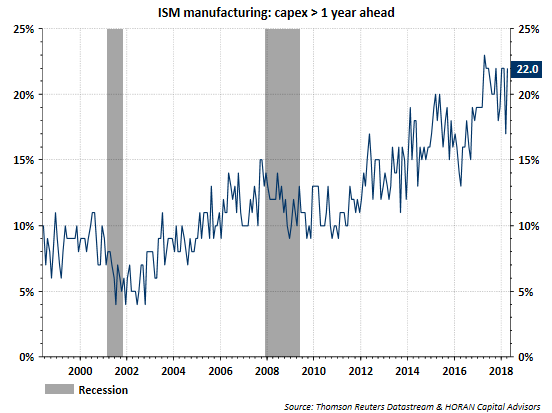
- Some recent 'bad' news commentary has centered around companies that have benefited from the tax cut not spending some of the increased profits on capital expenditures. First, the tax benefit just began this year and we are only five months into the current year. And secondly, many companies plan ahead for budget purposes and their 2018 capital expenditure budget was set prior to the tax cuts being passed and signed into law. In spite of the lateness in passing the tax cut bill, the below chart shows a continued increase in expected capital expenditures in the coming 12-month period. In the ISM May Report on Business, one factor highlighted was Survey respondents expect to increase capital expenditures in 2018 more than originally forecast at the end of 2017. Additionally, Ed Yardeni of Yardeni Research, publishes a comprehensive capital expenditure report that is a worthwhile review. The report reviews various capital expenditure categories with most showing an increased level of spending.
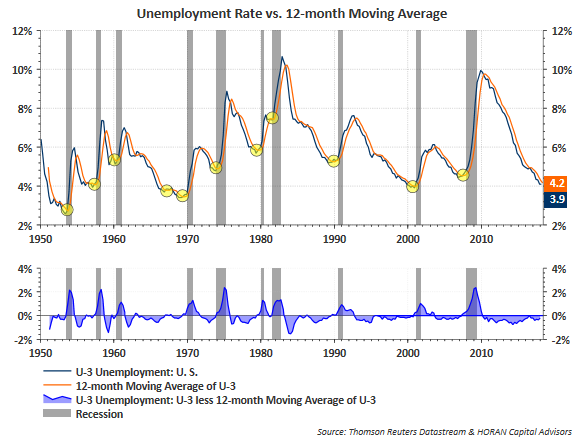
- And lastly on the economy, the job market continues to show strength. My report yesterday and linked to earlier contains commentary on the job market as well, but the below chart shows the low level of unemployment. If the unemployment rate were to cross the 12-month moving average of the rate from below, this would raise a yellow flag in regards to the sustainability of economic growth. At the moment though, the employment market looks strong and is reflective of a strong economy.
The purpose of this post is to highlight a number of the positive data points that one would expect to see in a strong economic environment like we are in now. Certainly, this is all known news and some will say markets are efficient and this should be priced in already. Nonetheless, if it is priced in and I do not fully believe, it is suggestive of further growth in the year ahead and this should be positive for stocks, all else being equal.
