Get 40% Off
🚨 Volatile Markets? Find Hidden Gems for Serious Outperformance
Find Stocks Now

One Gold Miner Showing An Impressive Breakout

Published 01/06/2015, 12:00 AM
Updated 07/09/2023, 06:31 AM

Gold stocks have been working on forming a bottom since the big October crash which took many gold miners to all-time lows and brought the Market Vectors Gold Miners ETF (ARCA:GDX) to below its 2008 Global Financial Crisis low. As the sector has begun to move back up during the past couple of weeks, some charts are breaking out from powerful chart pattern bottom setups.

One stock which stands out from the crowd due to several key technical characteristics is Detour Gold Corporation (TO:DGC), (OTC:DRGDF):
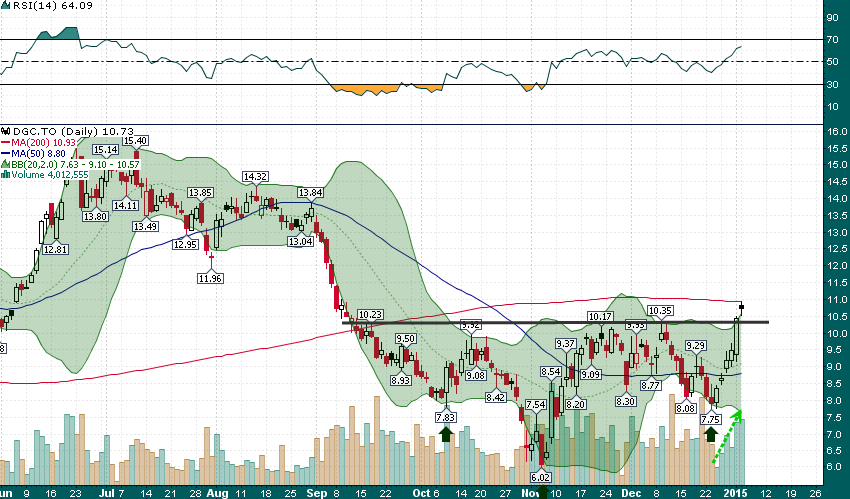
DGC Daily

Some of the key bullish technical characteristics of the DGC chart:

  • Price is at a 4-month high as it breaks out from a head and shoulders bottom
  • Volume is increasing as price moves higher (a key sign of confirmation)
  • There is a volume-by-price “air pocket” between $11 and $13 that goes back to the September sell-off
  • Relative strength is breaking out to 6-month highs and still has plenty of room before it enters ‘overbought’ territory

Detour is a highly attractive acquisition target due to its mine locations and size as pointed out by our James Fraser in November. The technicals offer a near term target ot $13+ and many fundamental analysts have valuations above $15 for DGC shares. Regardless of which way you look at it, Detour Gold looks to be heading higher.

Original post

Latest comments

Risk Disclosure: Trading in financial instruments and/or cryptocurrencies involves high risks including the risk of losing some, or all, of your investment amount, and may not be suitable for all investors. Prices of cryptocurrencies are extremely volatile and may be affected by external factors such as financial, regulatory or political events. Trading on margin increases the financial risks.
Before deciding to trade in financial instrument or cryptocurrencies you should be fully informed of the risks and costs associated with trading the financial markets, carefully consider your investment objectives, level of experience, and risk appetite, and seek professional advice where needed.
Fusion Media would like to remind you that the data contained in this website is not necessarily real-time nor accurate. The data and prices on the website are not necessarily provided by any market or exchange, but may be provided by market makers, and so prices may not be accurate and may differ from the actual price at any given market, meaning prices are indicative and not appropriate for trading purposes. Fusion Media and any provider of the data contained in this website will not accept liability for any loss or damage as a result of your trading, or your reliance on the information contained within this website.
It is prohibited to use, store, reproduce, display, modify, transmit or distribute the data contained in this website without the explicit prior written permission of Fusion Media and/or the data provider. All intellectual property rights are reserved by the providers and/or the exchange providing the data contained in this website.
Fusion Media may be compensated by the advertisers that appear on the website, based on your interaction with the advertisements or advertisers.
© 2007-2024 - Fusion Media Limited. All Rights Reserved.