On Friday, crude oil lost 0.61% as disappointing U.S. economic data and profit taking weighted on the price. Thanks to these circumstances, light crude declined below $103, approaching its first downside target. What’s next?
On Friday, the data showed that the Thomson Reuters/University of Michigan consumer sentiment index ticked up to 81.9, disappointing analytics expectations for a reading of 82.5. Additionally, the Commerce Department reported that personal spending in the U.S. dropped 0.1% last month, also below expectations for a 0.2% rise, while U.S. core personal consumption expenditures (without food and energy) rose 0.2% in April, in line with expectations. These disappointing data fueled worries that demand in the largest oil-consuming nation wouldn't be strong enough to reduce high supplies.
As a reminder, crude oil stocks climbed to 393 million barrels last week, not far from the record high of 399.4 million barrels reached in the week ended April 25, adding to demand concerns. Despite this build, the price of light crude moved higher as bigger-than expected drop in gasoline supplies and shrinking inventories in the Oklahoma overshadowed the above-mentioned increase in crude oil stocks. In reaction to this, investors locked in gains from Thursday's rally and sold the commodity for profits, pushing the price lower on Friday. Despite this fact and rising domestic supplies, crude oil ended the month up 3%, as traders focused on falling inventories in the Oklahoma.
North or south? Where will the commodity head next? Let’s look for answer on the charts (charts courtesy of http://stockcharts.com).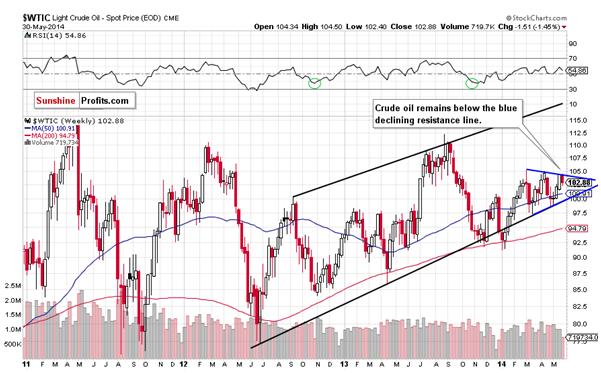
Looking at the weekly chart, we see that the medium-term picture hasn’t changed much as crude oil still remains below the blue resistance line based on the recent highs (the upper border of the triangle). Therefore, what we wrote in our last Oil Trading Alert is up-to-date:
If this line holds, we will likely see a pullback and the nearest support will be the 50-week moving average (currently at $100.80) the last week’s increase materialized on relative small volume, which questions the strength of oil bulls. On top of that, the RSI approached the level of 60. We saw similar reading in April and also earlier in March. Back then, such readings preceded declines. Therefore, if history repeats itself once again, we may see a correction in the coming week (or weeks).
Having said that, let’s focus on the very short-term picture.
Quoting our previous Oil Trading Alert:
the previously-broken lower border of the rising trend channel successfully stopped further improvement and the commodity reversed. Additionally, sell signals generated by the CCI and Stochastic Oscillator are still in play. Therefore, we remain bearish and see this upswing as nothing more than a verification of the breakdown below the black dashed line. If this is the case, the commodity will extend losses in the nearest future and the first downside target will be around $102.30, where the 38.2% Fibonacci retracement based on the entire May rally is.
As you see on the daily chart, oil bears almost realized the above-mentioned scenario on Friday, pushing the commodity to the daily low of $102.40. If the support level created by the 38.2% Fibonacci retracement holds, we may see a rebound in the coming day. Nevertheless, if it doesn’t stop the selling pressure, we will see further deterioration and the next target for oil bears will be the black medium-term declining support line (currently around $102).
- English (UK)
- English (India)
- English (Canada)
- English (Australia)
- English (South Africa)
- English (Philippines)
- English (Nigeria)
- Deutsch
- Español (España)
- Español (México)
- Français
- Italiano
- Nederlands
- Português (Portugal)
- Polski
- Português (Brasil)
- Русский
- Türkçe
- العربية
- Ελληνικά
- Svenska
- Suomi
- עברית
- 日本語
- 한국어
- 简体中文
- 繁體中文
- Bahasa Indonesia
- Bahasa Melayu
- ไทย
- Tiếng Việt
- हिंदी
Oil Trading Alert: Crude Oil For The Bulls Or Bears?
Published 06/03/2014, 05:47 AM
Updated 05/14/2017, 06:45 AM
Oil Trading Alert: Crude Oil For The Bulls Or Bears?
3rd party Ad. Not an offer or recommendation by Investing.com. See disclosure here or
remove ads
.
Latest comments
Install Our App
Risk Disclosure: Trading in financial instruments and/or cryptocurrencies involves high risks including the risk of losing some, or all, of your investment amount, and may not be suitable for all investors. Prices of cryptocurrencies are extremely volatile and may be affected by external factors such as financial, regulatory or political events. Trading on margin increases the financial risks.
Before deciding to trade in financial instrument or cryptocurrencies you should be fully informed of the risks and costs associated with trading the financial markets, carefully consider your investment objectives, level of experience, and risk appetite, and seek professional advice where needed.
Fusion Media would like to remind you that the data contained in this website is not necessarily real-time nor accurate. The data and prices on the website are not necessarily provided by any market or exchange, but may be provided by market makers, and so prices may not be accurate and may differ from the actual price at any given market, meaning prices are indicative and not appropriate for trading purposes. Fusion Media and any provider of the data contained in this website will not accept liability for any loss or damage as a result of your trading, or your reliance on the information contained within this website.
It is prohibited to use, store, reproduce, display, modify, transmit or distribute the data contained in this website without the explicit prior written permission of Fusion Media and/or the data provider. All intellectual property rights are reserved by the providers and/or the exchange providing the data contained in this website.
Fusion Media may be compensated by the advertisers that appear on the website, based on your interaction with the advertisements or advertisers.
© 2007-2024 - Fusion Media Limited. All Rights Reserved.