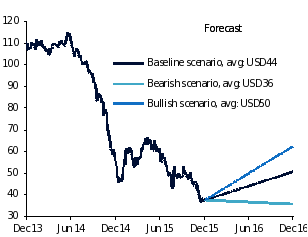
Oil markets have been over-supplied since the beginning of 2014. The build-up of inventories has led to a sharp decline in oil prices from USD115 per barrel (/b) in mid-2014 to USD34 currently. But the latest data show that the oil market is slowly adjusting to the demand/supply imbalances. Low prices are encouraging higher energy consumption and also pushing high-cost suppliers out of the market. The progress of this adjustment process as well as the impact of new shocks will determine oil prices in 2016. Under our baseline view of continued demand growth, US supply cuts, higher Iranian exports and sustained production from the rest of OPEC, we expect the Brent crude oil price to average USD44/b in 2016.
Oil markets are currently over-supplied by around 1.6m barrels per day (b/d). Four questions are likely to determine how this excess supply will be cleared and therefore shape oil markets in 2016. First, will the strong demand growth (which reached 1.6m b/d in 2015—a five-year high) persist into 2016? Second, how will the high-cost US shale producers respond to low priceswhich are making some of their businesses unviable? Third, when will the sanctions on Iran be lifted and how much more oil can Iran produce once they are lifted? Fourth, will the rest of OPEC continue producing at current levels or will geopolitical factors disrupt their production?
To assess how these questions will impact oil prices, we consider three scenarios. Each scenario gives a combination of viewson the four questions.
1. The baseline scenario. Under this scenario, we forecast oil demand to rise by 1.2m b/d in 2016, in line with the International Energy Agency (IEA). China and other developing Asian countries will continue to be the main driver of global demand growth. Chinese consumers’ rising demand for cars and transportation is outweighing slowing demand for energy in the industrial sector.We also assume that US shale oil production will be reduced by 0.4m b/d as some high-cost producers are driven out of the market. Consistent with the IEA, we assume a gradual ramp up in Iranian oil production, with Iran ultimately adding 0.6m b/d to global oil supply by June 2016 following the lifting of the sanctions in the second quarter of the year. Finally, we stipulate that that OPEC’s crude oil production—excluding the additional Iranian supply—will be maintained at current levels of 31.7m b/d.
Under this scenario, the excess supply in the market is likely to be reduced to 0.8m b/d. Based on the historical relationship between changes in excess supply and oil prices, we expect oil prices to average USD44/b in 2016,down from an average ofUSD54/b in 2015.
Brent crude oil price
(USD /b)

Sources: Bloomberg, IEA and QNB Economics forecasts
2. The bearish scenario. This scenario assumes a more subdued demand growth of around 0.9m b/d, equivalent to that of 2014. It assumes that US shale producers will not cut their output and manage to maintain production at current levels. Sanctions on Iran are assumed to be lifted in the first quarter of 2016 under this scenario. This will allow Iran to ramp up its production by 1.0m b/d by the end of the year, the upper end of the range of analysts’ estimates. Other OPEC countries are also assumed to pump out more oil, adding an average of 0.7m b/d.
Under this scenario, the market imbalances will widen and excess supply will increase to 2.2m b/d. As a result, oil prices are expected to average USD36/b in 2016, a decline of nearly a third compared to the 2015 average price.
3. The bullish scenario.This scenario stipulates that the strong 2015 demand growth of 1.6m b/d will persist into 2016. US supply is assumed to be cut by a more-than-expected 0.6m b/d. Iran is assumed to add only 0.3m b/d by end-2016. Production from other OPEC countries is expected to be reduced slightly, maybe due to geopolitical or security factors.
Under this scenario, the market will rebalance in 2016 with demand outgrowing supply by 0.3m b/d. As this starts to work out the large inventories built up over the last couple of years, oil prices will average USD50/b in 2016.
Conclusion.Recent turmoil in the oil markets is evidence that they are notoriously hard to predict. One way to deal with the significant uncertainties present in the market is to consider different scenarios. Our attempt to quantify how different views impact oil prices shows that oil prices are expected to average USD44/b in 2016 under our baseline case. A more bearish scenario, in which demand growth is more subdued than the baseline while supply growth is more robust, will result in oil prices averaging USD36/b. On the other hand, a more bullish scenario, in which we get deeper supply cuts and stronger demand growth, could lead to oil prices averaging USD50/b.
